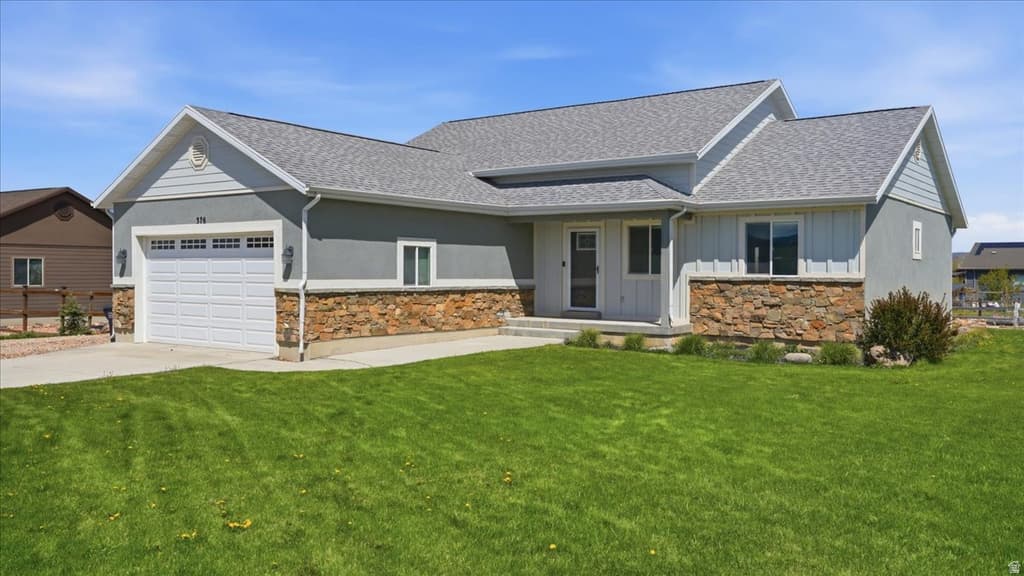
755 OAK, Kamas, UT 84036
4BD/—BA Residential in Kamas, UT 84036. 2,685 sqft. Built 1998. Listed at $1,125,000. MLS #2122281.
4BD/—BA Residential in Kamas, UT 84036. 2,685 sqft. Built 1998. Listed at $1,125,000. MLS #2122281.
Brand New Furnace. On Demand Water Heater Storage Shed, Additional shop w/ 2 separate garage doors. 8 X 12 Glass greenhouse with built in propane stove.
Property Type
Residential
Property Style
Single Family Residence
Architectural Style
Tri/Multi-Level
Stories
3
Subdivision
WILD WILLOW AMENDED PLANNEDDEVELOPMENT
County
Summit
Construction
Stone
Lot Size
0.49 sq ft
Above Grade Area
1,790 sq ft
Condition
Blt./Standing
MLS #
2122281
Property Type
Residential
Property Style
Single Family Residence
Architectural Style
Tri/Multi-Level
Stories
3
Subdivision
WILD WILLOW AMENDED PLANNEDDEVELOPMENT
County
Summit
Construction
Stone
Lot Size
0.49 sq ft
Above Grade Area
1,790 sq ft
Condition
Blt./Standing
MLS #
2122281
List Price
$1,125,000
Annual Taxes
$3,081
Home Warranty
No
List Price
$1,125,000
Annual Taxes
$3,081
Home Warranty
No
Heating
Gas: Central
Roof
Asphalt
Flooring
Hardwood
Basement
Full
Materials
Stone
Appliances
Refrigerator,Water Softener Owned
Patio & Porch
Porch: Open,Patio: Open
Water Source
Culinary
Sewer
Sewer: Connected,Sewer: Public
Heating
Gas: Central
Roof
Asphalt
Flooring
Hardwood
Basement
Full
Materials
Stone
Appliances
Refrigerator,Water Softener Owned
Patio & Porch
Porch: Open,Patio: Open
Water Source
Culinary
Sewer
Sewer: Connected,Sewer: Public
Garage Spaces
4
Covered Spaces
4
Total Parking
12
Garage Spaces
4
Covered Spaces
4
Total Parking
12
Why this is a deal
Classification
Great Deal (vs Market)
Deal Score
92/100
vs Similar Homes
6% above
vs Market Median
21% below
Area Growth (YoY)
0.6%
Deal Score Breakdown
92/100 · 1 qualifying signal
Priced 21% below the per-subtype city median
Priced 6% above the median of similar listings
0.6% year-over-year ZHVI growth in this area
LT net cashflow -$3,505/mo (-47.3% return on ownership cost) · STR net cashflow -$6,413/mo (-86.6% return). Uses the better of LT or STR against total monthly ownership cost (P&I, tax, insurance, HOA, maintenance).
No price reduction from original list
Ensemble scoring: the best single signal sets the floor, secondary qualifying signals (≥60) each add 5 points up to +20. A home that strongly wins on one dimension is already a great deal — it doesn't need to tick every box.
Why this classification
Monthly Rent
$4,430/mo
Range: $3,088 – $5,773
Net Monthly Cash Flow
−$3,506 /mo (−$42,072/yr)
Monthly rental income
Monthly ownership cost
Coverage
60%
Net /mo
−$3,505
DSCR
0.69
Est. Annual Revenue
$16,988/yr
$415/night · 35% occupancy · $79/bedroom · $0.11/sqft
Net Monthly Cash Flow
−$6,412 /mo (−$76,948/yr)
Monthly STR income
Monthly ownership cost
Coverage
19%
Net /mo
−$6,413
DSCR
0.18
School District
South Summit
Best Download
1 Gbps
Best Upload
1 Gbps
Fiber Available
Yes
Providers
7
Available Providers
$753,700
+49% vs median
88 days
105
$315,000 – $22,500,000
$3,081
Select agents you’d like to hear from. They’ll be notified of your interest — your contact details stay private until you choose to respond.

Devin Tanner - Utah Realtor

Salt Lake City Real Estate Broker Focused on Pricing, Positioning, and Results
Your inquiry goes to the listing agent.
Fast Response
Typically within 2 hours during business hours
Built with AI to help you find your perfect home
Powered by AI • Secured by Supabase • Trusted by Agents