43 300, Santaquin, UT 84655
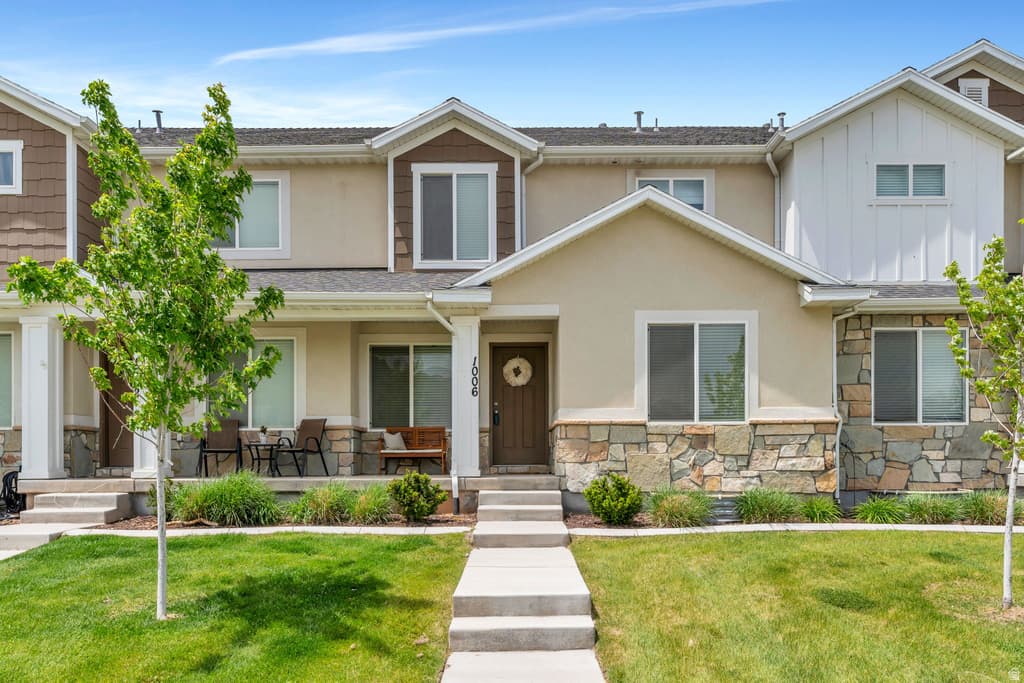
3BD/—BA Residential in Santaquin, UT 84655. 1,859 sqft. Built 2020. Listed at $272,000. MLS #2163909.
3BD/—BA Residential in Santaquin, UT 84655. 1,859 sqft. Built 2020. Listed at $272,000. MLS #2163909.
Great Santaquin location, newer style townhome. Easy to show. $100 down payment program available with an FHA loan, no repairs needed to go FHA. price reduction. online bidding, ask your agent for details. 3 bedroom. garage too! Equal housing opportunity
Property Type
Residential
Property Style
Townhouse
Architectural Style
Townhouse; Row-mid
Stories
3
Subdivision
HIGH PARK
County
Utah
Zoning
Single-Family
Construction
Stone,Stucco,Cement Siding
Lot Size
0.02 sq ft
Above Grade Area
1,859 sq ft
Condition
Blt./Standing
MLS #
2163909
Property Type
Residential
Property Style
Townhouse
Architectural Style
Townhouse; Row-mid
Stories
3
Subdivision
HIGH PARK
County
Utah
Zoning
Single-Family
Construction
Stone,Stucco,Cement Siding
Lot Size
0.02 sq ft
Above Grade Area
1,859 sq ft
Condition
Blt./Standing
MLS #
2163909
List Price
$272,000
HOA Fees
$260 / Monthly
Annual Taxes
$1,800
Home Warranty
No
List Price
$272,000
HOA Fees
$260 / Monthly
Annual Taxes
$1,800
Home Warranty
No
Heating
Forced Air,Gas: Central
Cooling
Central Air
Roof
Asphalt
Flooring
Carpet,Laminate
Basement
None,Slab
Materials
Stone,Stucco,Cement Siding
Water Source
Culinary
Sewer
Sewer: Connected,Sewer: Public
View
Mountain(s)
Heating
Forced Air,Gas: Central
Cooling
Central Air
Roof
Asphalt
Flooring
Carpet,Laminate
Basement
None,Slab
Materials
Stone,Stucco,Cement Siding
Water Source
Culinary
Sewer
Sewer: Connected,Sewer: Public
View
Mountain(s)
Garage Spaces
1
Covered Spaces
1
Total Parking
2
Garage Spaces
1
Covered Spaces
1
Total Parking
2
$499,900
-46% vs median
61 days
147
$280,000 – $3,450,000
$1,800
$260/monthly
Low Crime
4.7
per 1,000
10.1
per 1,000
3.9
per 1,000
18.6
per 1,000
National rates use FBI UCR Index Crimes. Local rates use NIBRS which may include additional offense categories.
Your inquiry goes to the listing agent.
Fast Response
Typically within 2 hours during business hours
Built with AI to help you find your perfect home
Powered by AI • Secured by Supabase • Trusted by Agents