5673 ASPEN, South Ogden, UT 84403
2BD/—BA Residential in South Ogden, UT 84403. 1,174 sqft. Built 1979. Listed at $245,000. MLS #2169303.
2BD/—BA Residential in South Ogden, UT 84403. 1,174 sqft. Built 1979. Listed at $245,000. MLS #2169303.
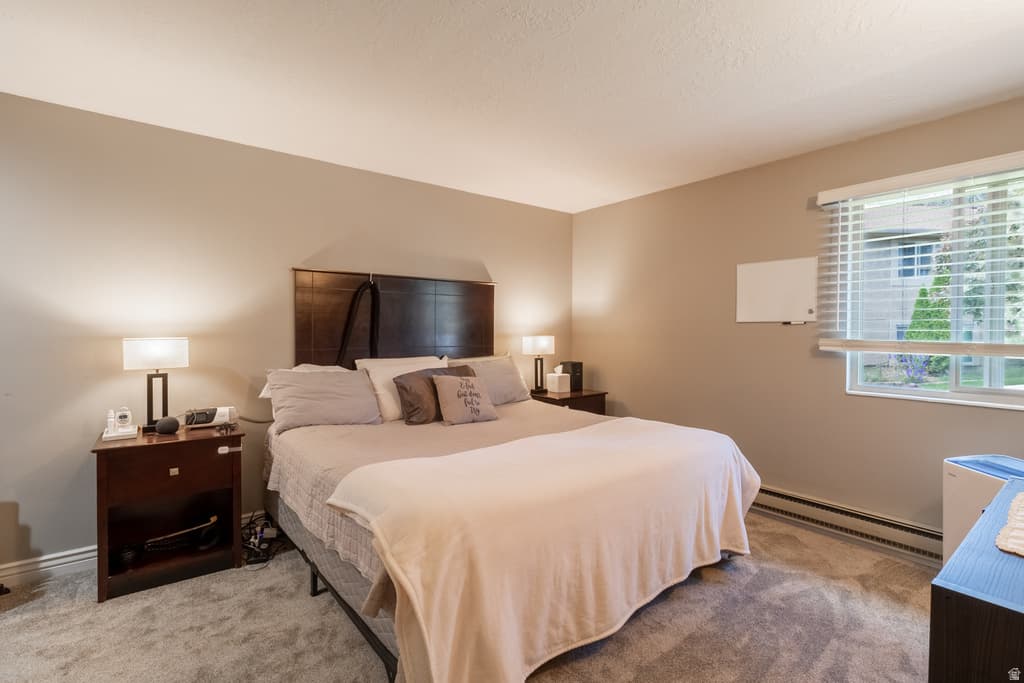
2 Bed 2 Bath Condo in the quiet and convenient South Ogden Community! Super close to shopping, dining, and highway 89. Don't pay rent, when you can own for cheaper! Furnace is new, and exterior maintenance is paid through the HOA. The community pool is well maintained and open all summer long. Schedule your showing today!
Property Type
Residential
Property Style
Condominium
Architectural Style
Townhouse; Row-mid
Stories
2
Subdivision
YORKSHIRE MEADOWS
County
Weber
Construction
Cedar,Stone
Lot Size
0.04 sq ft
Above Grade Area
598 sq ft
Condition
Blt./Standing
MLS #
2169303
Property Type
Residential
Property Style
Condominium
Architectural Style
Townhouse; Row-mid
Stories
2
Subdivision
YORKSHIRE MEADOWS
County
Weber
Construction
Cedar,Stone
Lot Size
0.04 sq ft
Above Grade Area
598 sq ft
Condition
Blt./Standing
MLS #
2169303
List Price
$245,000
HOA Fees
$187 / Monthly
Annual Taxes
$1,605
Home Warranty
No
List Price
$245,000
HOA Fees
$187 / Monthly
Annual Taxes
$1,605
Home Warranty
No
Heating
Forced Air
Cooling
Evaporative Cooling
Roof
Asphalt
Flooring
Carpet,Tile
Basement
Full
Materials
Cedar,Stone
Appliances
Ceiling Fan,Dryer,Refrigerator,Washer
Water Source
Culinary
Sewer
Sewer: Connected
View
Mountain(s)
Heating
Forced Air
Cooling
Evaporative Cooling
Roof
Asphalt
Flooring
Carpet,Tile
Basement
Full
Materials
Cedar,Stone
Appliances
Ceiling Fan,Dryer,Refrigerator,Washer
Water Source
Culinary
Sewer
Sewer: Connected
View
Mountain(s)
Covered Spaces
1
Total Parking
1
Covered Spaces
1
Total Parking
1
Why this is a deal
Classification
Great Deal (vs Similar)
Deal Score
100/100
vs Similar Homes
27% below
vs Market Median
2% above
Area Growth (YoY)
8.4%
Deal Score Breakdown
100/100 · 2 qualifying signals
Priced 27% below the median of similar listings
8.4% year-over-year ZHVI growth in this area
Priced 2% above the per-subtype city median
LT net cashflow -$281/mo (-15.0% return on ownership cost) · STR net cashflow -$568/mo (-30.3% return). Uses the better of LT or STR against total monthly ownership cost (P&I, tax, insurance, HOA, maintenance).
No price reduction from original list
Ensemble scoring: the best single signal sets the floor, secondary qualifying signals (≥60) each add 5 points up to +20. A home that strongly wins on one dimension is already a great deal — it doesn't need to tick every box.
Why this classification
Monthly Rent
$1,814/mo
Range: $1,146 – $2,481
Net Monthly Cash Flow
−$281 /mo (−$3,375/yr)
Monthly rental income
Monthly ownership cost
Coverage
97%
Net /mo
−$281
DSCR
1.30
Est. Annual Revenue
$22,443/yr
$358/night · 41% occupancy · $123/bedroom · $0.38/sqft
Net Monthly Cash Flow
−$568 /mo (−$6,816/yr)
Monthly STR income
Monthly ownership cost
Coverage
100%
Net /mo
−$568
DSCR
1.06
Best Download
2 Gbps
Best Upload
1 Gbps
Fiber Available
Yes
Providers
12
Available Providers
$439,500
-44% vs median
59 days
62
$169,000 – $1,250,000
$1,605
$187/monthly
Moderate
11.2
per 1,000
22.2
per 1,000
13.2
per 1,000
46.6
per 1,000
National rates use FBI UCR Index Crimes. Local rates use NIBRS which may include additional offense categories.
Select agents you’d like to hear from. They’ll be notified of your interest — your contact details stay private until you choose to respond.

Salt Lake City Real Estate Broker Focused on Pricing, Positioning, and Results

Devin Tanner - Utah Realtor

Salt Lake City Specialist Driving Smart Home Deals
Your inquiry goes to the listing agent.
Fast Response
Typically within 2 hours during business hours
Built with AI to help you find your perfect home
Powered by AI • Secured by Supabase • Trusted by Agents