5600 MEADOW, South Ogden, UT 84403
1BD/—BA Residential in South Ogden, UT 84403. 638 sqft. Built 1971. Listed at $169,000. MLS #2146236.
1BD/—BA Residential in South Ogden, UT 84403. 638 sqft. Built 1971. Listed at $169,000. MLS #2146236.
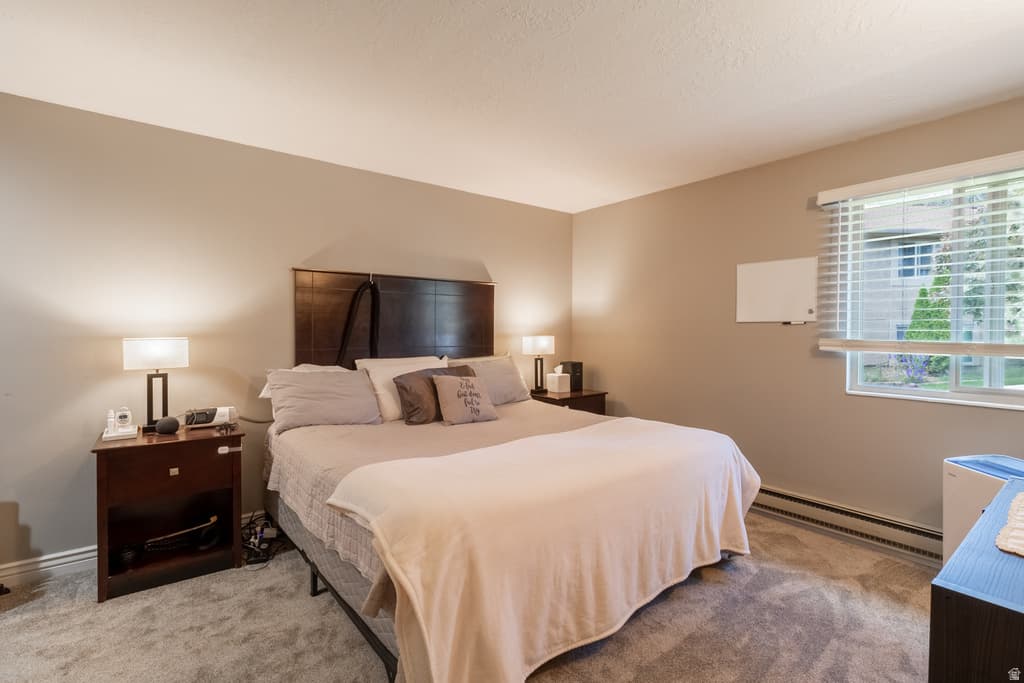
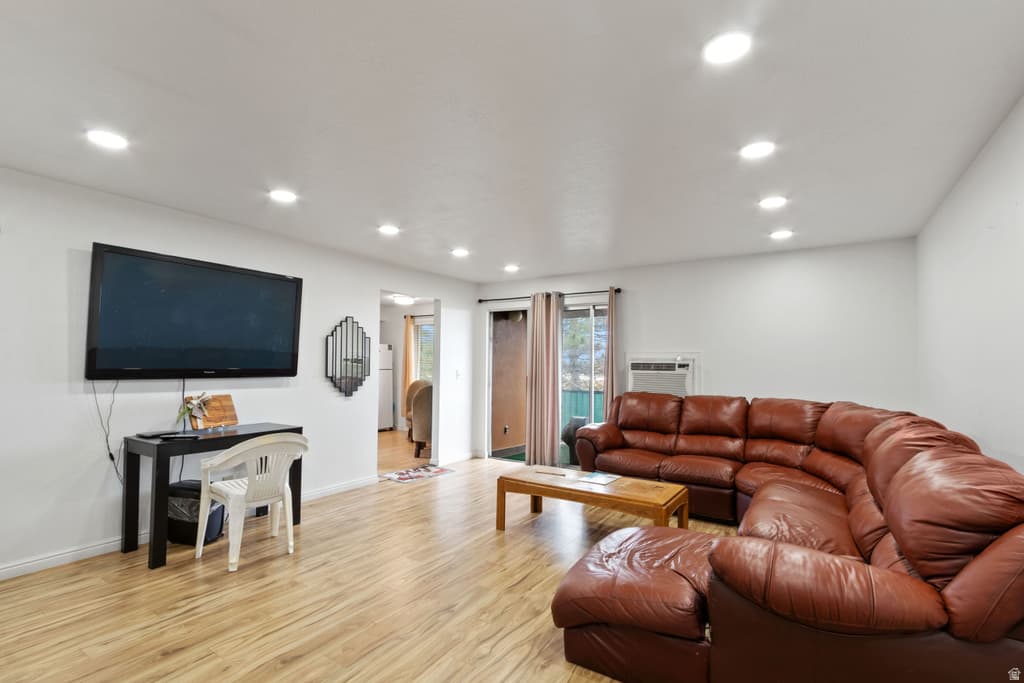
Rent keeps going up. This might be your sign to own instead. Granite counters, new stainless steel appliances, gas stove, fireplace, feature wall, barn door, LVP flooring, walk in closet, portable AC, and even a hot and cold bidet. Low maintenance living in a great location close to Weber State University and McKay Dee Hospital. This would be a great option for a first time buyer, owner occupant, student, hospital employee, or investment property. It is time to own something instead of rent, and this might be your chance.
Property Type
Residential
Property Style
Condominium
Architectural Style
Condo; Main Level
Stories
1
Subdivision
THE MEADOWS
County
Weber
Zoning
Multi-Family
Construction
Stucco
Lot Size
0.01 sq ft
Above Grade Area
638 sq ft
Condition
Blt./Standing
MLS #
2146236
Property Type
Residential
Property Style
Condominium
Architectural Style
Condo; Main Level
Stories
1
Subdivision
THE MEADOWS
County
Weber
Zoning
Multi-Family
Construction
Stucco
Lot Size
0.01 sq ft
Above Grade Area
638 sq ft
Condition
Blt./Standing
MLS #
2146236
List Price
$169,000
Original Price
$179,900
HOA Fees
$302 / Monthly
Annual Taxes
$1,123
Home Warranty
No
List Price
$169,000
Original Price
$179,900
HOA Fees
$302 / Monthly
Annual Taxes
$1,123
Home Warranty
No
Heating
Forced Air
Cooling
Window Unit(s)
Roof
Asphalt
Basement
None
Materials
Stucco
Appliances
Refrigerator
Patio & Porch
Patio: Open
Water Source
Culinary
Sewer
Sewer: Connected
Heating
Forced Air
Cooling
Window Unit(s)
Roof
Asphalt
Basement
None
Materials
Stucco
Appliances
Refrigerator
Patio & Porch
Patio: Open
Water Source
Culinary
Sewer
Sewer: Connected
Covered Spaces
1
Total Parking
1
Covered Spaces
1
Total Parking
1
Why this is a deal
Classification
Great Deal (vs Similar)
Deal Score
100/100
vs Similar Homes
50% below
vs Market Median
9% above
Price Reduced
6.1%
Area Growth (YoY)
8.4%
Deal Score Breakdown
100/100 · 3 qualifying signals
Priced 50% below the median of similar listings
8.4% year-over-year ZHVI growth in this area
6% price reduction from original list — seller may be motivated
Priced 9% above the per-subtype city median
LT net cashflow -$724/mo (-49.1% return on ownership cost) · STR net cashflow -$786/mo (-53.3% return). Uses the better of LT or STR against total monthly ownership cost (P&I, tax, insurance, HOA, maintenance).
Ensemble scoring: the best single signal sets the floor, secondary qualifying signals (≥60) each add 5 points up to +20. A home that strongly wins on one dimension is already a great deal — it doesn't need to tick every box.
Why this classification
Monthly Rent
$853/mo
Range: $493 – $1,212
Net Monthly Cash Flow
−$724 /mo (−$8,683/yr)
Monthly rental income
Monthly ownership cost
Coverage
58%
Net /mo
−$724
DSCR
0.88
Est. Annual Revenue
$11,797/yr
$358/night · 41% occupancy · $123/bedroom · $0.38/sqft
Net Monthly Cash Flow
−$787 /mo (−$9,450/yr)
Monthly STR income
Monthly ownership cost
Coverage
67%
Net /mo
−$786
DSCR
0.81
Best Download
2 Gbps
Best Upload
250 Mbps
Fiber Available
No
Providers
11
Available Providers
$415,000
-59% vs median
61 days
55
$169,000 – $1,250,000
$1,123
$302/monthly
Moderate
11.2
per 1,000
22.2
per 1,000
13.2
per 1,000
46.6
per 1,000
National rates use FBI UCR Index Crimes. Local rates use NIBRS which may include additional offense categories.
Select agents you’d like to hear from. They’ll be notified of your interest — your contact details stay private until you choose to respond.

Salt Lake City Real Estate Broker Focused on Pricing, Positioning, and Results

Devin Tanner - Utah Realtor

Salt Lake City Specialist Driving Smart Home Deals
Your inquiry goes to the listing agent.
Fast Response
Typically within 2 hours during business hours
Built with AI to help you find your perfect home
Powered by AI • Secured by Supabase • Trusted by Agents