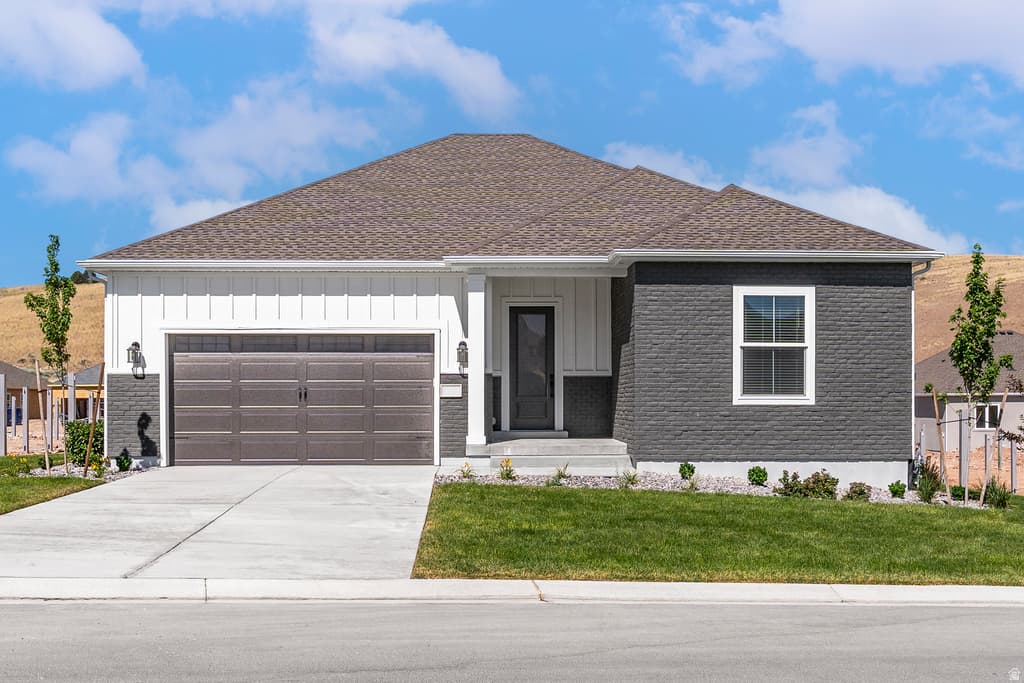
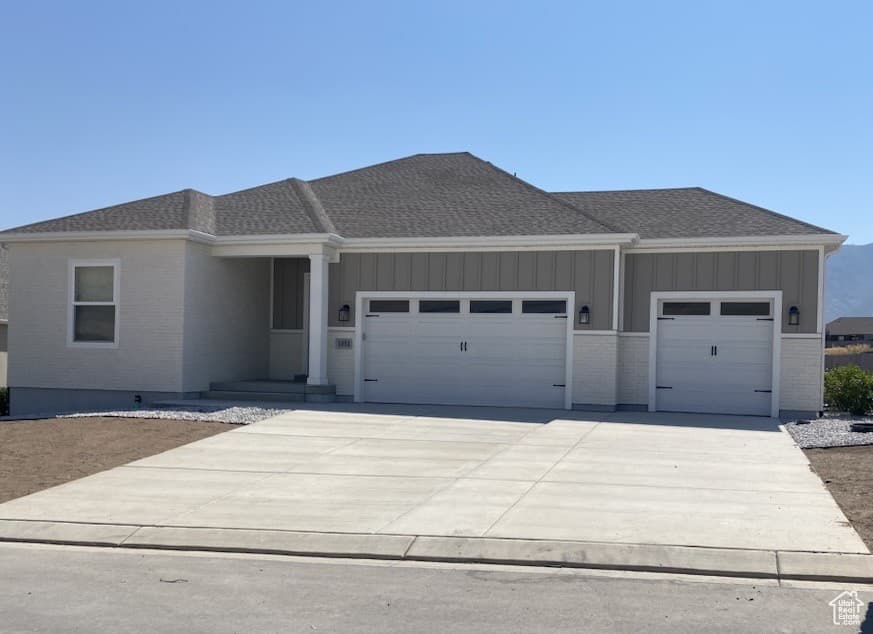
1380 WEST VIEW, Santaquin, UT 84655
3BD/—BA Residential in Santaquin, UT 84655. 3,470 sqft. Built 2025. Listed at $599,900. MLS #2149780.
3BD/—BA Residential in Santaquin, UT 84655. 3,470 sqft. Built 2025. Listed at $599,900. MLS #2149780.
Brand new homes in a serene atmosphere! Get exactly what you want! Lots actually worth the price! Come see for yourself this beautiful 3 bedroom 2 bathroom home that is sure to blow your socks off!
Property Type
Residential
Property Style
Single Family Residence
Architectural Style
Rambler/Ranch
Stories
2
Subdivision
VISTAS AT SUMMIT RDG
County
Utah
Zoning
Single-Family
Construction
Asphalt,Brick,Cement Siding
Lot Size
0.34 sq ft
Above Grade Area
1,767 sq ft
MLS #
2149780
Property Type
Residential
Property Style
Single Family Residence
Architectural Style
Rambler/Ranch
Stories
2
Subdivision
VISTAS AT SUMMIT RDG
County
Utah
Zoning
Single-Family
Construction
Asphalt,Brick,Cement Siding
Lot Size
0.34 sq ft
Above Grade Area
1,767 sq ft
MLS #
2149780
List Price
$599,900
HOA Fees
$30 / Quarterly
Home Warranty
Yes
List Price
$599,900
HOA Fees
$30 / Quarterly
Home Warranty
Yes
Heating
Forced Air,Gas: Central,>= 95% efficiency
Cooling
Central Air
Roof
Asbestos Shingle,Pitched
Flooring
Carpet
Basement
Full
Materials
Asphalt,Brick,Cement Siding
Appliances
Ceiling Fan,Microwave,Range Hood
Laundry
Electric Dryer Hookup
Water Source
Culinary,Irrigation
Sewer
Sewer: Connected,Sewer: Public
Garage Spaces
2
Covered Spaces
2
Total Parking
2
Garage Spaces
2
Covered Spaces
2
Total Parking
2
Why this is a deal
Classification
Growth Market DealDeal Score
85/100
vs Similar Homes
7% below
vs Market Median
8% above
Area Growth (YoY)
10.0%
Deal Score Breakdown
85/100 · 2 qualifying signals
10.0% year-over-year ZHVI growth in this area
Priced 7% below the median of similar listings
LT net cashflow -$310/mo (-8.1% return on ownership cost) · STR net cashflow -$2,766/mo (-72.4% return). Uses the better of LT or STR against total monthly ownership cost (P&I, tax, insurance, HOA, maintenance).
Priced 8% above the per-subtype city median
No price reduction from original list
Ensemble scoring: the best single signal sets the floor, secondary qualifying signals (≥60) each add 5 points up to +20. A home that strongly wins on one dimension is already a great deal — it doesn't need to tick every box.
Why this classification
Monthly Rent
$3,990/mo
Range: $2,984 – $4,997
Net Monthly Cash Flow
−$310 /mo (−$3,723/yr)
Monthly rental income
Monthly ownership cost
Coverage
104%
Net /mo
−$310
DSCR
1.17
Est. Annual Revenue
$18,093/yr
$164/night · 43% occupancy · $80/bedroom · $0.08/sqft
Net Monthly Cash Flow
−$2,765 /mo (−$33,186/yr)
Monthly STR income
Monthly ownership cost
Coverage
40%
Net /mo
−$2,766
DSCR
0.35
Best Download
1000 Gbps
Best Upload
1000 Gbps
Fiber Available
Yes
Providers
12
Available Providers
$495,000
+21% vs median
68 days
137
$290,000 – $3,450,000
$30/quarterly
Low Crime
4.7
per 1,000
10.1
per 1,000
3.9
per 1,000
18.6
per 1,000
National rates use FBI UCR Index Crimes. Local rates use NIBRS which may include additional offense categories.
Select agents you’d like to hear from. They’ll be notified of your interest — your contact details stay private until you choose to respond.
Your inquiry goes to the listing agent.
Fast Response
Typically within 2 hours during business hours
Built with AI to help you find your perfect home
Powered by AI • Secured by Supabase • Trusted by Agents