327 270, Tremonton, UT 84337
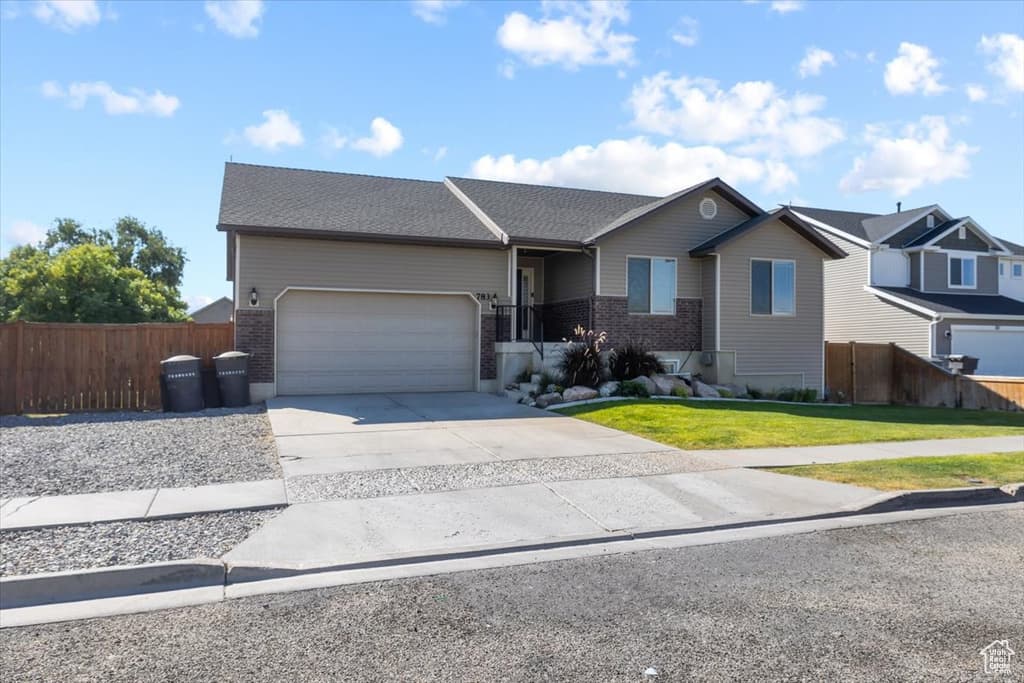
5BD/—BA Residential in Tremonton, UT 84337. 2,080 sqft. Built 1999. Listed at $349,900. MLS #2166335.
5BD/—BA Residential in Tremonton, UT 84337. 2,080 sqft. Built 1999. Listed at $349,900. MLS #2166335.
No description available for this property.
Property Type
Residential
Property Style
Single Family Residence
Architectural Style
Rambler/Ranch
Stories
2
County
Box Elder
Zoning
Single-Family
Construction
Aluminum
Lot Size
0.17 sq ft
Above Grade Area
1,040 sq ft
Condition
Blt./Standing
MLS #
2166335
Property Type
Residential
Property Style
Single Family Residence
Architectural Style
Rambler/Ranch
Stories
2
County
Box Elder
Zoning
Single-Family
Construction
Aluminum
Lot Size
0.17 sq ft
Above Grade Area
1,040 sq ft
Condition
Blt./Standing
MLS #
2166335
List Price
$349,900
Annual Taxes
$2,358
Home Warranty
No
List Price
$349,900
Annual Taxes
$2,358
Home Warranty
No
Heating
Forced Air,Gas: Central
Cooling
Central Air
Roof
Asphalt
Flooring
Carpet,Linoleum
Basement
Daylight,Full
Materials
Aluminum
Appliances
Range Hood,Refrigerator
Water Source
Culinary
Sewer
Sewer: Connected
Heating
Forced Air,Gas: Central
Cooling
Central Air
Roof
Asphalt
Flooring
Carpet,Linoleum
Basement
Daylight,Full
Materials
Aluminum
Appliances
Range Hood,Refrigerator
Water Source
Culinary
Sewer
Sewer: Connected
Covered Spaces
2
Total Parking
4
Covered Spaces
2
Total Parking
4
Why this is a deal
Classification
Great Deal (vs Similar)
Deal Score
100/100
vs Similar Homes
22% below
vs Market Median
7% below
Area Growth (YoY)
9.4%
Deal Score Breakdown
100/100 · 4 qualifying signals
Priced 22% below the median of similar listings
LT net cashflow +$22/mo (+0.9% return on ownership cost) · STR net cashflow +$713/mo (+29.5% return). Uses the better of LT or STR against total monthly ownership cost (P&I, tax, insurance, HOA, maintenance).
9.4% year-over-year ZHVI growth in this area
Priced 7% below the per-subtype city median
No price reduction from original list
Ensemble scoring: the best single signal sets the floor, secondary qualifying signals (≥60) each add 5 points up to +20. A home that strongly wins on one dimension is already a great deal — it doesn't need to tick every box.
Why this classification
Monthly Rent
$2,775/mo
Range: $2,093 – $3,456
Net Monthly Cash Flow
+$23 /mo (+$271/yr)
Monthly rental income
Monthly ownership cost
Coverage
115%
Net /mo
+$22
DSCR
1.39
Est. Annual Revenue
$53,702/yr
$123/night · 31% occupancy · $123/bedroom
Net Monthly Cash Flow
+$712 /mo (+$8,541/yr)
Monthly STR income
Monthly ownership cost
Coverage
185%
Net /mo
+$713
DSCR
1.78
Best Download
10 Gbps
Best Upload
10 Gbps
Fiber Available
Yes
Providers
14
Available Providers
$384,900
-9% vs median
72 days
79
$229,900 – $1,495,000
$2,358
Select agents you’d like to hear from. They’ll be notified of your interest — your contact details stay private until you choose to respond.
Your inquiry goes to the listing agent.
Fast Response
Typically within 2 hours during business hours
Built with AI to help you find your perfect home
Powered by AI • Secured by Supabase • Trusted by Agents