974 400, Salem, UT 84653
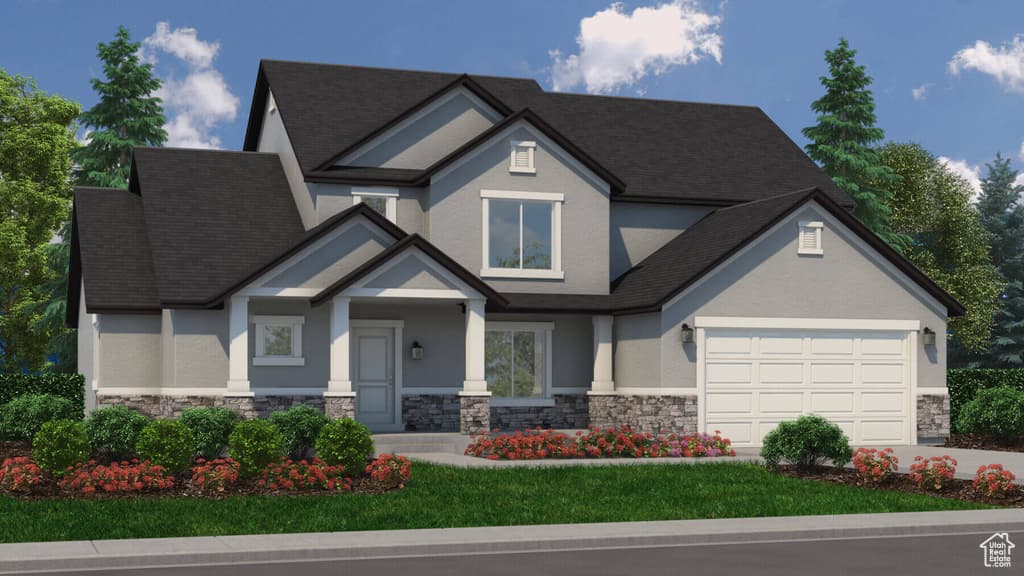
4BD/—BA Residential in Salem, UT 84653. 4,060 sqft. Built 2025. Listed at $769,900. MLS #2119489.
4BD/—BA Residential in Salem, UT 84653. 4,060 sqft. Built 2025. Listed at $769,900. MLS #2119489.
Check out our Maya model home! With 4 finished bedrooms, PLUS a front living/office, this plan leaves all the options open. The primary is on the main level, with the 3 additional bedrooms on the upper level. The upper-level bedrooms all have large closets, plus a loft! This stunning home has a 2/1 buy-down. Reach out to the listing agent to tour this home today!
Property Type
Residential
Property Style
Single Family Residence
Architectural Style
Stories: 2
Stories
3
Subdivision
BROAD HOLLOW
County
Utah
Zoning
Single-Family
Construction
Asphalt,Stucco,Cement Siding
Lot Size
0.23 sq ft
Above Grade Area
2,534 sq ft
Condition
Blt./Standing
MLS #
2119489
Property Type
Residential
Property Style
Single Family Residence
Architectural Style
Stories: 2
Stories
3
Subdivision
BROAD HOLLOW
County
Utah
Zoning
Single-Family
Construction
Asphalt,Stucco,Cement Siding
Lot Size
0.23 sq ft
Above Grade Area
2,534 sq ft
Condition
Blt./Standing
MLS #
2119489
List Price
$769,900
Home Warranty
No
List Price
$769,900
Home Warranty
No
Heating
Forced Air,Gas: Central,>= 95% efficiency
Cooling
Central Air
Roof
Asphalt
Flooring
Carpet,Laminate,Tile
Basement
Full
Materials
Asphalt,Stucco,Cement Siding
Water Source
Culinary
Sewer
Sewer: Connected
Heating
Forced Air,Gas: Central,>= 95% efficiency
Cooling
Central Air
Roof
Asphalt
Flooring
Carpet,Laminate,Tile
Basement
Full
Materials
Asphalt,Stucco,Cement Siding
Water Source
Culinary
Sewer
Sewer: Connected
Garage Spaces
3
Covered Spaces
3
Total Parking
6
Garage Spaces
3
Covered Spaces
3
Total Parking
6
Classification
Standard
Deal Score
45/100
vs Similar Homes
5% above
vs Market Median
8% above
Area Growth (YoY)
4.1%
Deal Score Breakdown
45/100
4.1% year-over-year ZHVI growth in this area
Priced 8% above the per-subtype city median
LT net cashflow -$1,063/mo (-21.7% return on ownership cost) · STR net cashflow -$2,215/mo (-45.3% return). Uses the better of LT or STR against total monthly ownership cost (P&I, tax, insurance, HOA, maintenance).
Priced 5% above the median of similar listings
No price reduction from original list
Ensemble scoring: the best single signal sets the floor, secondary qualifying signals (≥60) each add 5 points up to +20. A home that strongly wins on one dimension is already a great deal — it doesn't need to tick every box.
Why this classification
Monthly Rent
$4,350/mo
Range: $3,285 – $5,415
Net Monthly Cash Flow
−$1,063 /mo (−$12,759/yr)
Monthly rental income
Monthly ownership cost
Coverage
89%
Net /mo
−$1,063
DSCR
0.99
Est. Annual Revenue
$45,876/yr
$283/night · 41% occupancy · $114/bedroom · $0.17/sqft
Net Monthly Cash Flow
−$2,214 /mo (−$26,571/yr)
Monthly STR income
Monthly ownership cost
Coverage
78%
Net /mo
−$2,215
DSCR
0.69
Best Download
10 Gbps
Best Upload
10 Gbps
Fiber Available
Yes
Providers
12
Available Providers
$544,000
+42% vs median
78 days
164
$305,000 – $2,595,000
Very Safe
2.9
per 1,000
7.6
per 1,000
4.7
per 1,000
15.3
per 1,000
National rates use FBI UCR Index Crimes. Local rates use NIBRS which may include additional offense categories.
Select agents you’d like to hear from. They’ll be notified of your interest — your contact details stay private until you choose to respond.

Salt Lake City Real Estate Broker Focused on Pricing, Positioning, and Results

Daryn Edmunds - High Road Properties
Your inquiry goes to the listing agent.
Fast Response
Typically within 2 hours during business hours
Built with AI to help you find your perfect home
Powered by AI • Secured by Supabase • Trusted by Agents