260 265, Richmond, UT 84333
3BD/—BA Residential in Richmond, UT 84333. 1,504 sqft. Built 2026. Listed at $449,000. MLS #2165050.
3BD/—BA Residential in Richmond, UT 84333. 1,504 sqft. Built 2026. Listed at $449,000. MLS #2165050.
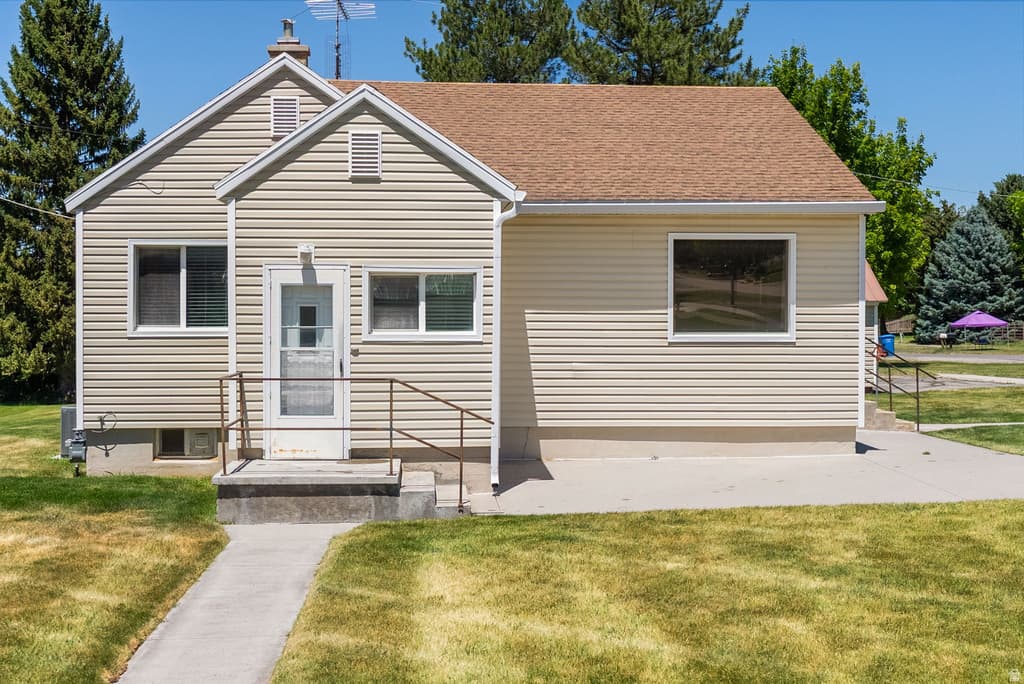
Brand new construction home offering peaceful country living on .34 acres. You'll love this open concept floor plan featuring three bedrooms, two full baths, stylish kitchen, and spacious family room. This home is ready for a new owner!
Property Type
Residential
Property Style
Single Family Residence
Architectural Style
Rambler/Ranch
Stories
1
Subdivision
JOHNSON VIEW ESTATES
County
Cache
Zoning
Single-Family
Construction
Asphalt,Stone
Lot Size
0.34 sq ft
Above Grade Area
1,504 sq ft
Condition
Blt./Standing
MLS #
2165050
Property Type
Residential
Property Style
Single Family Residence
Architectural Style
Rambler/Ranch
Stories
1
Subdivision
JOHNSON VIEW ESTATES
County
Cache
Zoning
Single-Family
Construction
Asphalt,Stone
Lot Size
0.34 sq ft
Above Grade Area
1,504 sq ft
Condition
Blt./Standing
MLS #
2165050
List Price
$449,000
Annual Taxes
$1
Home Warranty
No
List Price
$449,000
Annual Taxes
$1
Home Warranty
No
Heating
Forced Air
Cooling
Central Air
Roof
Asphalt
Flooring
Carpet
Basement
Slab
Materials
Asphalt,Stone
Appliances
Microwave
Water Source
Culinary
Sewer
Sewer: Connected
Heating
Forced Air
Cooling
Central Air
Roof
Asphalt
Flooring
Carpet
Basement
Slab
Materials
Asphalt,Stone
Appliances
Microwave
Water Source
Culinary
Sewer
Sewer: Connected
Garage Spaces
2
Covered Spaces
2
Total Parking
2
Garage Spaces
2
Covered Spaces
2
Total Parking
2
Why this is a deal
Classification
Great Deal (vs Similar)
Deal Score
100/100
vs Similar Homes
20% below
vs Market Median
2% above
Area Growth (YoY)
7.7%
Deal Score Breakdown
100/100 · 2 qualifying signals
Priced 20% below the median of similar listings
7.7% year-over-year ZHVI growth in this area
Priced 2% above the per-subtype city median
LT net cashflow -$1,317/mo (-46.2% return on ownership cost) · STR net cashflow -$1,560/mo (-54.7% return). Uses the better of LT or STR against total monthly ownership cost (P&I, tax, insurance, HOA, maintenance).
No price reduction from original list
Ensemble scoring: the best single signal sets the floor, secondary qualifying signals (≥60) each add 5 points up to +20. A home that strongly wins on one dimension is already a great deal — it doesn't need to tick every box.
Why this classification
Monthly Rent
$1,745/mo
Range: $481 – $3,008
Net Monthly Cash Flow
−$1,317 /mo (−$15,800/yr)
Monthly rental income
Monthly ownership cost
Coverage
61%
Net /mo
−$1,317
DSCR
0.68
Est. Annual Revenue
$22,167/yr
$390/night · 42% occupancy · $107/bedroom · $0.21/sqft
Net Monthly Cash Flow
−$1,559 /mo (−$18,713/yr)
Monthly STR income
Monthly ownership cost
Coverage
65%
Net /mo
−$1,560
DSCR
0.57
Best Download
2 Gbps
Best Upload
285 Mbps
Fiber Available
No
Providers
9
Available Providers
$427,000
+5% vs median
80 days
8
$365,000 – $775,000
$1
Select agents you’d like to hear from. They’ll be notified of your interest — your contact details stay private until you choose to respond.
Your inquiry goes to the listing agent.
Fast Response
Typically within 2 hours during business hours
Built with AI to help you find your perfect home
Powered by AI • Secured by Supabase • Trusted by Agents