250 700, Richfield, UT 84701
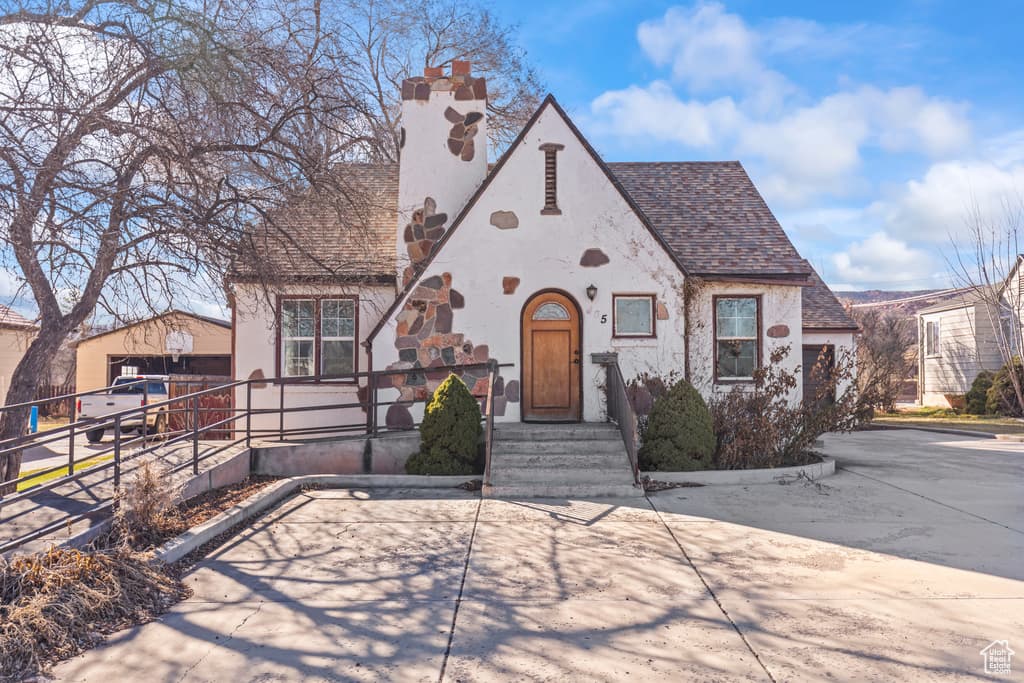
3BD/—BA Residential in Richfield, UT 84701. 1,593 sqft. Built 1939. Listed at $315,000. MLS #2136488.
3BD/—BA Residential in Richfield, UT 84701. 1,593 sqft. Built 1939. Listed at $315,000. MLS #2136488.
Updated Duplex offers a great opportunity for many different families. Live in one side and rent the other. Or use as a profitable investment property. Amazing investment property with great location for long term or short term rentals. Opportunity to build additional attached unit on this large property with city approval. Units are side by side and both have W/D included. Perfect location, close to schools and shopping. Unit #A is a ground level unit, and unit #B has a basement. Lots of room to park an RV, if that is a must. Buyer and agent to verify listing information and all measurements. This property has active renters. Please allow 24 hrs notice for all showings.
Property Type
Residential
Property Style
Duplex
Architectural Style
Side By Side
County
Sevier
Zoning
Multi-Family
Construction
Stucco,Clapboard
Lot Size
0.35 sq ft
Condition
Blt./Standing
MLS #
2136488
Property Type
Residential
Property Style
Duplex
Architectural Style
Side By Side
County
Sevier
Zoning
Multi-Family
Construction
Stucco,Clapboard
Lot Size
0.35 sq ft
Condition
Blt./Standing
MLS #
2136488
List Price
$315,000
Annual Taxes
$2,827
Home Warranty
No
List Price
$315,000
Annual Taxes
$2,827
Home Warranty
No
Heating
Wall Furnace
Roof
Asphalt
Flooring
Carpet,Laminate
Materials
Stucco,Clapboard
Laundry
Electric Dryer Hookup
Patio & Porch
Porch: Open
Water Source
Culinary
Sewer
Sewer: Connected,Sewer: Public
View
View: Red Rock
Heating
Wall Furnace
Roof
Asphalt
Flooring
Carpet,Laminate
Materials
Stucco,Clapboard
Laundry
Electric Dryer Hookup
Patio & Porch
Porch: Open
Water Source
Culinary
Sewer
Sewer: Connected,Sewer: Public
View
View: Red Rock
Covered Spaces
0
Total Parking
4
Covered Spaces
0
Total Parking
4
Why this is a deal
Classification
Standard
Deal Score
100/100
vs Market Median
14% above
Area Growth (YoY)
12.3%
Deal Score Breakdown
100/100 · 1 qualifying signal
12.3% year-over-year ZHVI growth in this area
Priced 14% above the per-subtype city median
STR net cashflow -$1,393/mo (-61.6% return). Uses the better of LT or STR against total monthly ownership cost (P&I, tax, insurance, HOA, maintenance).
No price reduction from original list
Not enough comparable listings
Ensemble scoring: the best single signal sets the floor, secondary qualifying signals (≥60) each add 5 points up to +20. A home that strongly wins on one dimension is already a great deal — it doesn't need to tick every box.
Why this classification
Est. Annual Revenue
$14,900/yr
$171/night · 22% occupancy · $67/bedroom · $0.13/sqft
Net Monthly Cash Flow
−$1,392 /mo (−$16,704/yr)
Monthly STR income
Monthly ownership cost
Coverage
55%
Net /mo
−$1,393
DSCR
0.54
Best Download
2 Gbps
Best Upload
2 Gbps
Fiber Available
Yes
Providers
9
Available Providers
$350,000
-10% vs median
47 days
38
$80,000 – $1,299,000
$2,827
High Crime
20.8
per 1,000
30.6
per 1,000
10.8
per 1,000
62.2
per 1,000
National rates use FBI UCR Index Crimes. Local rates use NIBRS which may include additional offense categories.
Select agents you’d like to hear from. They’ll be notified of your interest — your contact details stay private until you choose to respond.

Daryn Edmunds - High Road Properties

Salt Lake City Real Estate Broker Focused on Pricing, Positioning, and Results

Celeste Green - Utah Real Estate Agent
Your inquiry goes to the listing agent.
Fast Response
Typically within 2 hours during business hours
Built with AI to help you find your perfect home
Powered by AI • Secured by Supabase • Trusted by Agents