740 28TH, Ogden, UT 84403
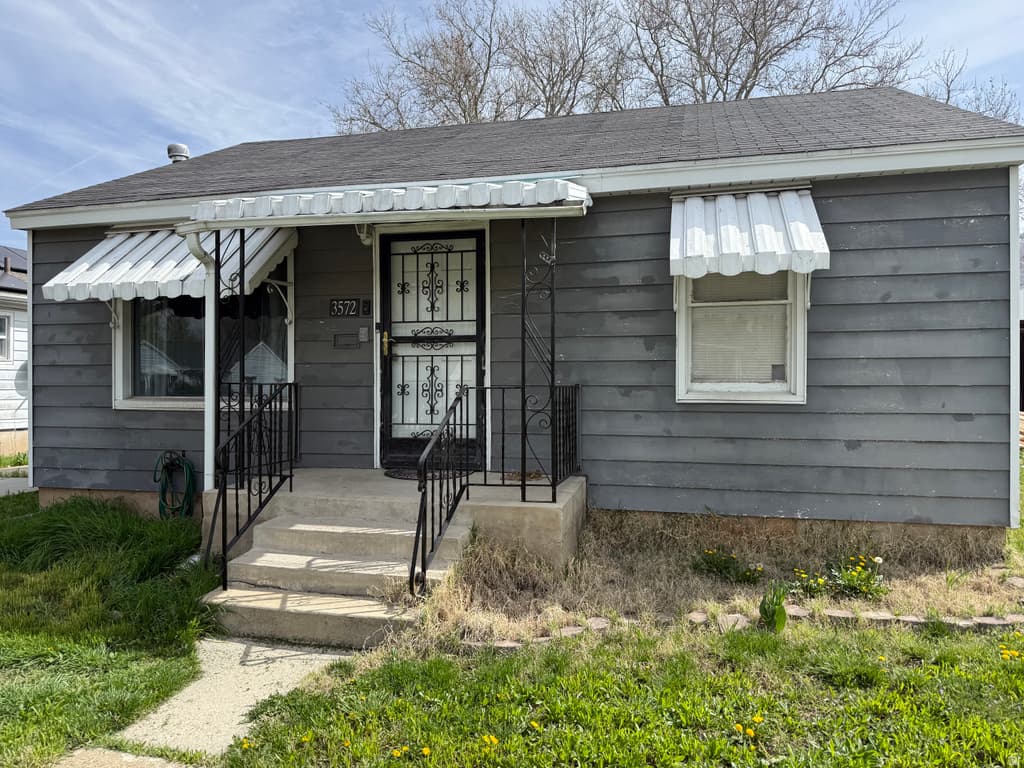
1BD/—BA Residential in Ogden, UT 84403. 752 sqft. Built 1965. Listed at $254,000. MLS #2166363.
1BD/—BA Residential in Ogden, UT 84403. 752 sqft. Built 1965. Listed at $254,000. MLS #2166363.
NO HOA! Beautifully redone town home surrounded by an established neighborhood near downtown Ogden. Nearly 100% rebuilt, everything has been redone including new water lines, sewer lines, concrete floor, framing, roof, etc. You will love the vaulted ceilings with a stunning custom kitchen with granite counter tops. Home includes brand new fire sprinklers and mini-splits for your heating and cooling. Commercial grade TPO roof. New appliances include range/oven, and dishwasher. May qualify for own in Ogden.
Property Type
Residential
Property Style
Single Family Residence
Architectural Style
Townhouse; Row-end
Stories
1
County
Weber
Zoning
Single-Family
Construction
Cement Siding
Lot Size
0.02 sq ft
Above Grade Area
752 sq ft
Condition
Blt./Standing
MLS #
2166363
Property Type
Residential
Property Style
Single Family Residence
Architectural Style
Townhouse; Row-end
Stories
1
County
Weber
Zoning
Single-Family
Construction
Cement Siding
Lot Size
0.02 sq ft
Above Grade Area
752 sq ft
Condition
Blt./Standing
MLS #
2166363
List Price
$254,000
Annual Taxes
$1,627
Home Warranty
No
List Price
$254,000
Annual Taxes
$1,627
Home Warranty
No
Heating
Electric
Roof
Membrane
Materials
Cement Siding
Appliances
Refrigerator
Laundry
Electric Dryer Hookup
Water Source
Culinary
Heating
Electric
Roof
Membrane
Materials
Cement Siding
Appliances
Refrigerator
Laundry
Electric Dryer Hookup
Water Source
Culinary
Covered Spaces
0
Total Parking
0
Covered Spaces
0
Total Parking
0
Why this is a deal
Classification
Great Deal (vs Similar)
Deal Score
100/100
vs Similar Homes
24% below
vs Market Median
7% above
Area Growth (YoY)
9.6%
Deal Score Breakdown
100/100 · 2 qualifying signals
Priced 24% below the median of similar listings
9.6% year-over-year ZHVI growth in this area
Priced 7% above the per-subtype city median
LT net cashflow -$1,282/mo (-73.3% return on ownership cost) · STR net cashflow -$990/mo (-56.6% return). Uses the better of LT or STR against total monthly ownership cost (P&I, tax, insurance, HOA, maintenance).
No price reduction from original list
Ensemble scoring: the best single signal sets the floor, secondary qualifying signals (≥60) each add 5 points up to +20. A home that strongly wins on one dimension is already a great deal — it doesn't need to tick every box.
Why this classification
Monthly Rent
$531/mo
Range: $276 – $785
Net Monthly Cash Flow
−$1,282 /mo (−$15,387/yr)
Monthly rental income
Monthly ownership cost
Coverage
30%
Net /mo
−$1,282
DSCR
0.37
Est. Annual Revenue
$13,020/yr
$358/night · 41% occupancy · $123/bedroom · $0.38/sqft
Net Monthly Cash Flow
−$990 /mo (−$11,883/yr)
Monthly STR income
Monthly ownership cost
Coverage
62%
Net /mo
−$990
DSCR
0.60
Best Download
10 Gbps
Best Upload
10 Gbps
Fiber Available
Yes
Providers
15
Available Providers
$385,000
-34% vs median
54 days
339
$180,000 – $2,800,000
$1,627
High Crime
19.2
per 1,000
36.9
per 1,000
23.6
per 1,000
79.7
per 1,000
National rates use FBI UCR Index Crimes. Local rates use NIBRS which may include additional offense categories.
Select agents you’d like to hear from. They’ll be notified of your interest — your contact details stay private until you choose to respond.

Salt Lake City Real Estate Broker Focused on Pricing, Positioning, and Results

Devin Tanner - Utah Realtor

Salt Lake City Specialist Driving Smart Home Deals
Your inquiry goes to the listing agent.
Fast Response
Typically within 2 hours during business hours
Built with AI to help you find your perfect home
Powered by AI • Secured by Supabase • Trusted by Agents