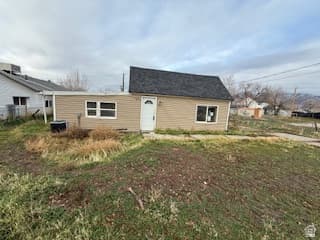
2865 PINGREE, Ogden, UT 84401
3BD/—BA Residential in Ogden, UT 84401. 801 sqft. Built 1941. Listed at $260,000. MLS #2129458.
3BD/—BA Residential in Ogden, UT 84401. 801 sqft. Built 1941. Listed at $260,000. MLS #2129458.
Your new home has arrived. Perfectly sized with 2 bedrooms and versatile living spaces, this home checks every box on your list. The beautifully appointed kitchen showcases quartz counters and stainless steel appliances - designed to delight any aspiring chef. Move-in ready touches, including updated flooring, bring comfort and character to every room. Conveniently located just minutes from downtown, great dining, and shopping. Included 100-Day Home Warranty with buyer activation.
Property Type
Residential
Property Style
Single Family Residence
Architectural Style
Rambler/Ranch
Stories
1
County
Weber
Zoning
Single-Family
Lot Size
0.1 sq ft
Above Grade Area
801 sq ft
Condition
Blt./Standing
MLS #
2129458
Property Type
Residential
Property Style
Single Family Residence
Architectural Style
Rambler/Ranch
Stories
1
County
Weber
Zoning
Single-Family
Lot Size
0.1 sq ft
Above Grade Area
801 sq ft
Condition
Blt./Standing
MLS #
2129458
List Price
$260,000
Original Price
$285,000
Annual Taxes
$1,828
Home Warranty
No
List Price
$260,000
Original Price
$285,000
Annual Taxes
$1,828
Home Warranty
No
Roof
Asphalt
Flooring
Carpet,Laminate
Basement
None
Sewer
Sewer: Public
Roof
Asphalt
Flooring
Carpet,Laminate
Basement
None
Sewer
Sewer: Public
Covered Spaces
0
Total Parking
0
Covered Spaces
0
Total Parking
0
Why this is a deal
Classification
Great Deal (vs Similar)
Deal Score
100/100
vs Similar Homes
20% below
vs Market Median
3% below
Price Reduced
8.8%
Area Growth (YoY)
10.1%
Deal Score Breakdown
100/100 · 3 qualifying signals
10.1% year-over-year ZHVI growth in this area
Priced 20% below the median of similar listings
9% price reduction from original list — seller may be motivated
Priced 3% below the per-subtype city median
LT net cashflow -$978/mo (-54.0% return on ownership cost) · STR net cashflow -$585/mo (-32.3% return). Uses the better of LT or STR against total monthly ownership cost (P&I, tax, insurance, HOA, maintenance).
Ensemble scoring: the best single signal sets the floor, secondary qualifying signals (≥60) each add 5 points up to +20. A home that strongly wins on one dimension is already a great deal — it doesn't need to tick every box.
Why this classification
Monthly Rent
$945/mo
Range: $750 – $1,140
Net Monthly Cash Flow
−$978 /mo (−$11,731/yr)
Monthly rental income
Monthly ownership cost
Coverage
52%
Net /mo
−$978
DSCR
0.63
Est. Annual Revenue
$20,985/yr
$358/night · 41% occupancy · $123/bedroom · $0.38/sqft
Net Monthly Cash Flow
−$585 /mo (−$7,018/yr)
Monthly STR income
Monthly ownership cost
Coverage
97%
Net /mo
−$585
DSCR
0.93
Best Download
10 Gbps
Best Upload
10 Gbps
Fiber Available
Yes
Providers
14
Available Providers
$385,000
-32% vs median
58 days
335
$174,999 – $2,800,000
$1,828
High Crime
19.2
per 1,000
36.9
per 1,000
23.6
per 1,000
79.7
per 1,000
National rates use FBI UCR Index Crimes. Local rates use NIBRS which may include additional offense categories.
Select agents you’d like to hear from. They’ll be notified of your interest — your contact details stay private until you choose to respond.

Salt Lake City Real Estate Broker Focused on Pricing, Positioning, and Results

Devin Tanner - Utah Realtor

Salt Lake City Specialist Driving Smart Home Deals
Your inquiry goes to the listing agent.
Fast Response
Typically within 2 hours during business hours
Built with AI to help you find your perfect home
Powered by AI • Secured by Supabase • Trusted by Agents