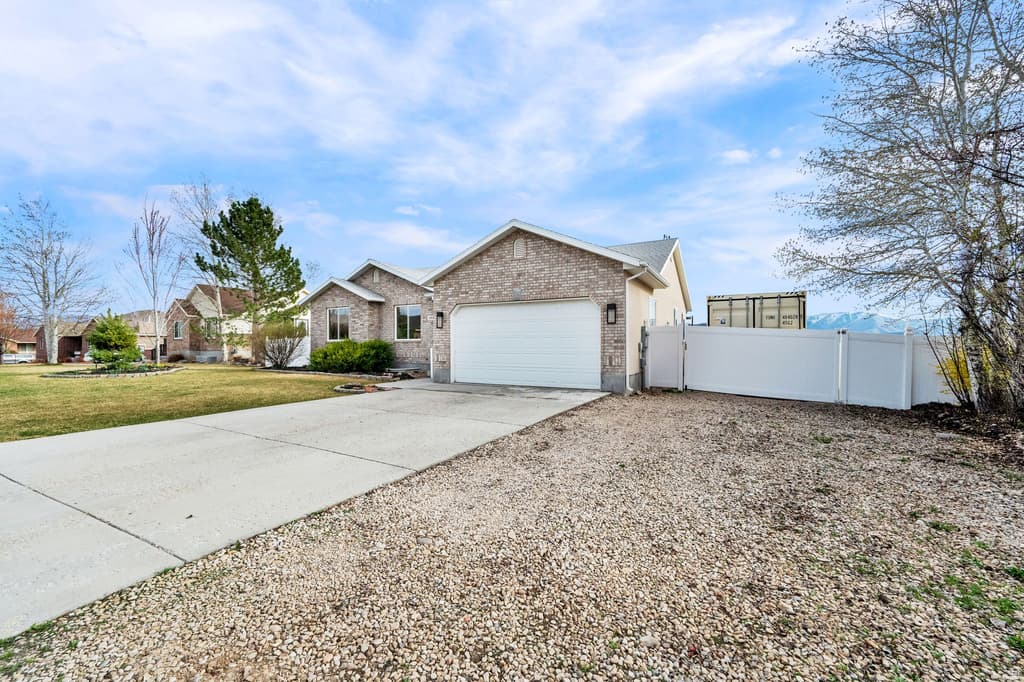
108 MONTE ROSA, Midway, UT 84049
4BD/—BA Residential in Midway, UT 84049. 3,392 sqft. Built 2021. Listed at $1,295,000. MLS #2157947.
4BD/—BA Residential in Midway, UT 84049. 3,392 sqft. Built 2021. Listed at $1,295,000. MLS #2157947.
No description available for this property.
Property Type
Residential
Property Style
Single Family Residence
Architectural Style
Rambler/Ranch
Stories
2
Subdivision
APPENZELL PUD PHASE
County
Wasatch
Zoning
Single-Family
Construction
Stucco,Cement Siding
Lot Size
0.1 sq ft
Above Grade Area
1,696 sq ft
Condition
Blt./Standing
MLS #
2157947
Property Type
Residential
Property Style
Single Family Residence
Architectural Style
Rambler/Ranch
Stories
2
Subdivision
APPENZELL PUD PHASE
County
Wasatch
Zoning
Single-Family
Construction
Stucco,Cement Siding
Lot Size
0.1 sq ft
Above Grade Area
1,696 sq ft
Condition
Blt./Standing
MLS #
2157947
List Price
$1,295,000
HOA Fees
$320 / Monthly
Annual Taxes
$6,208
Home Warranty
No
List Price
$1,295,000
HOA Fees
$320 / Monthly
Annual Taxes
$6,208
Home Warranty
No
Heating
Forced Air,Gas: Central,>= 95% efficiency
Cooling
Central Air
Roof
Asphalt,Metal
Flooring
Carpet,Laminate,Tile
Basement
Full
Materials
Stucco,Cement Siding
Laundry
Electric Dryer Hookup
Patio & Porch
Covered
Water Source
Culinary,Irrigation
Sewer
Sewer: Connected,Sewer: Public
View
Mountain(s)
Garage Spaces
2
Covered Spaces
2
Total Parking
2
Garage Spaces
2
Covered Spaces
2
Total Parking
2
Classification
Standard
Deal Score
10/100
vs Similar Homes
36% above
vs Market Median
24% above
Area Growth (YoY)
0.2%
Deal Score Breakdown
10/100
Priced 36% above the median of similar listings
Priced 24% above the per-subtype city median
0.2% year-over-year ZHVI growth in this area
LT net cashflow -$3,992/mo (-43.7% return on ownership cost) · STR net cashflow -$7,064/mo (-77.4% return). Uses the better of LT or STR against total monthly ownership cost (P&I, tax, insurance, HOA, maintenance).
No price reduction from original list
Ensemble scoring: the best single signal sets the floor, secondary qualifying signals (≥60) each add 5 points up to +20. A home that strongly wins on one dimension is already a great deal — it doesn't need to tick every box.
Monthly Rent
$5,834/mo
Range: $4,274 – $7,395
Net Monthly Cash Flow
−$3,992 /mo (−$47,902/yr)
Monthly rental income
Monthly ownership cost
Coverage
64%
Net /mo
−$3,992
DSCR
0.78
Est. Annual Revenue
$35,350/yr
$193/night · 39% occupancy · $125/bedroom · $0.24/sqft
Net Monthly Cash Flow
−$7,064 /mo (−$84,768/yr)
Monthly STR income
Monthly ownership cost
Coverage
32%
Net /mo
−$7,064
DSCR
0.31
Best Download
2 Gbps
Best Upload
2 Gbps
Fiber Available
Yes
Providers
10
Available Providers
$1,050,000
+23% vs median
115 days
98
$189,000 – $6,990,000
$6,208
$320/monthly
Select agents you’d like to hear from. They’ll be notified of your interest — your contact details stay private until you choose to respond.

Daryn Edmunds - High Road Properties

Salt Lake City Real Estate Broker Focused on Pricing, Positioning, and Results

Devin Tanner - Utah Realtor
Your inquiry goes to the listing agent.
Fast Response
Typically within 2 hours during business hours
Built with AI to help you find your perfect home
Powered by AI • Secured by Supabase • Trusted by Agents