290 600, Logan, UT 84321
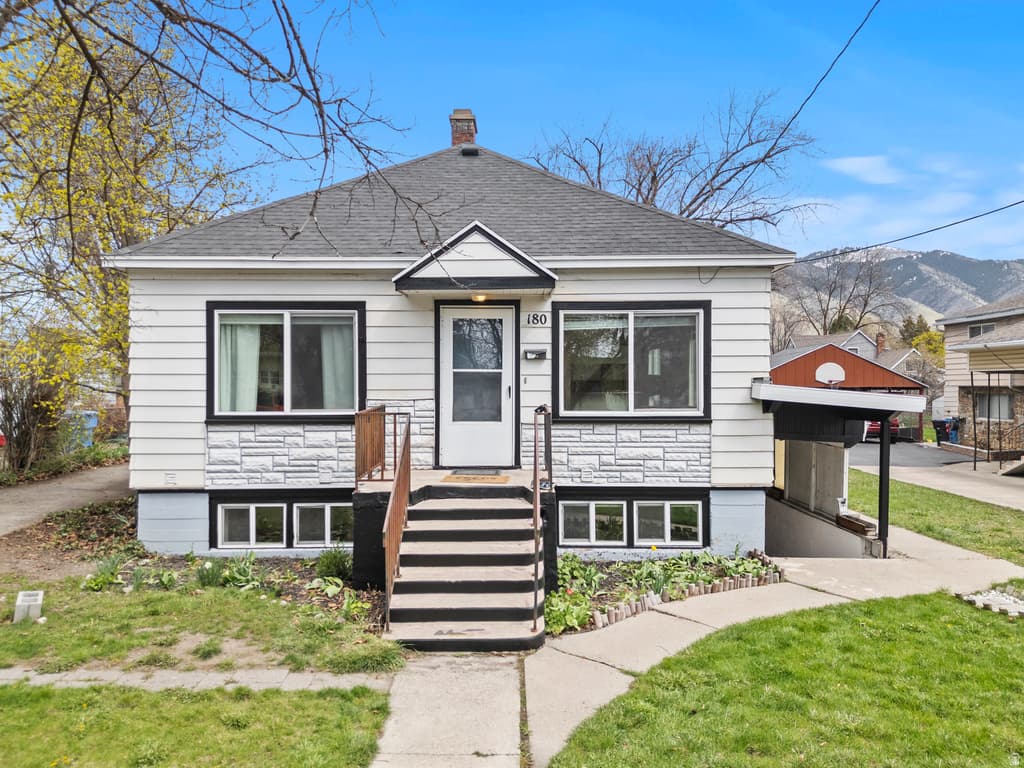
4BD/—BA Residential in Logan, UT 84321. 1,934 sqft. Built 1971. Listed at $485,900. MLS #2163502.
4BD/—BA Residential in Logan, UT 84321. 1,934 sqft. Built 1971. Listed at $485,900. MLS #2163502.
Check out this side-by-side duplex in the heart of Logan. This duplex has separate meters, a private yard, metal siding, an aluminum roof, new exterior doors, and new double-pane windows throughout the entire duplex. This duplex has had consistent rent for over 30 years under the current homeowner. Take advantage of this opportunity because they don't come up on the market often!
Property Type
Residential
Property Style
Duplex
Architectural Style
Side By Side
County
Cache
Zoning
Single-Family, Short Term Rental Allowed
Construction
Metal Siding
Lot Size
0.25 sq ft
Condition
Blt./Standing
MLS #
2163502
Property Type
Residential
Property Style
Duplex
Architectural Style
Side By Side
County
Cache
Zoning
Single-Family, Short Term Rental Allowed
Construction
Metal Siding
Lot Size
0.25 sq ft
Condition
Blt./Standing
MLS #
2163502
List Price
$485,900
Annual Taxes
$1,524
Home Warranty
No
List Price
$485,900
Annual Taxes
$1,524
Home Warranty
No
Heating
Gas: Central
Roof
Aluminum
Flooring
Carpet,Linoleum,Tile
Materials
Metal Siding
Laundry
Electric Dryer Hookup
Patio & Porch
Porch: Open
Water Source
Culinary
Sewer
Sewer: Connected,Sewer: Public
Heating
Gas: Central
Roof
Aluminum
Flooring
Carpet,Linoleum,Tile
Materials
Metal Siding
Laundry
Electric Dryer Hookup
Patio & Porch
Porch: Open
Water Source
Culinary
Sewer
Sewer: Connected,Sewer: Public
Covered Spaces
2
Total Parking
6
Covered Spaces
2
Total Parking
6
Why this is a deal
Classification
Great Deal (vs Similar)
Deal Score
85/100
vs Similar Homes
12% below
vs Market Median
75% above
Area Growth (YoY)
8.4%
Deal Score Breakdown
85/100 · 2 qualifying signals
8.4% year-over-year ZHVI growth in this area
Priced 12% below the median of similar listings
Priced 75% above the per-subtype city median
STR net cashflow -$1,610/mo (-49.9% return). Uses the better of LT or STR against total monthly ownership cost (P&I, tax, insurance, HOA, maintenance).
No price reduction from original list
Ensemble scoring: the best single signal sets the floor, secondary qualifying signals (≥60) each add 5 points up to +20. A home that strongly wins on one dimension is already a great deal — it doesn't need to tick every box.
Why this classification
Est. Annual Revenue
$27,668/yr
$94/night · 78% occupancy · $39/bedroom · $0.11/sqft
Net Monthly Cash Flow
−$1,610 /mo (−$19,314/yr)
Monthly STR income
Monthly ownership cost
Coverage
72%
Net /mo
−$1,610
DSCR
0.66
Best Download
10 Gbps
Best Upload
10 Gbps
Fiber Available
Yes
Providers
13
Available Providers
$425,000
+14% vs median
64 days
140
$215,000 – $4,190,000
$1,524
Moderate
9.9
per 1,000
18.3
per 1,000
13.7
per 1,000
41.9
per 1,000
National rates use FBI UCR Index Crimes. Local rates use NIBRS which may include additional offense categories.
Select agents you’d like to hear from. They’ll be notified of your interest — your contact details stay private until you choose to respond.
Your inquiry goes to the listing agent.
Fast Response
Typically within 2 hours during business hours
Built with AI to help you find your perfect home
Powered by AI • Secured by Supabase • Trusted by Agents