348 200, Logan, UT 84321
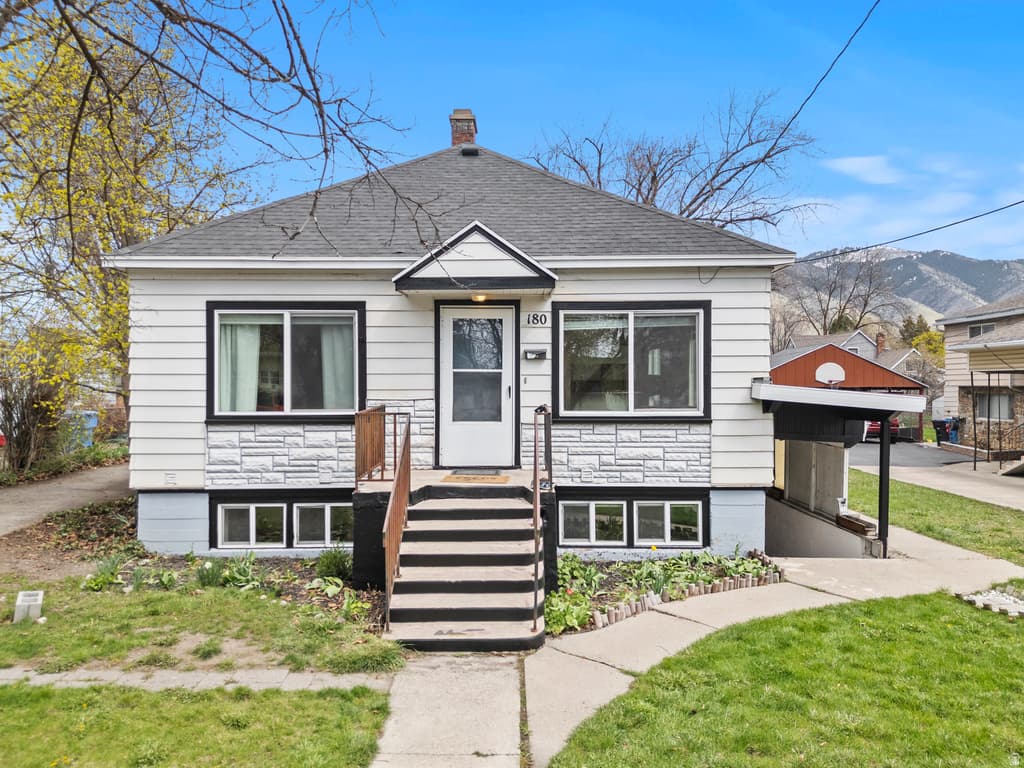
2BD/—BA Residential in Logan, UT 84321. 1,440 sqft. Built 1940. Listed at $350,000. MLS #2159954.
2BD/—BA Residential in Logan, UT 84321. 1,440 sqft. Built 1940. Listed at $350,000. MLS #2159954.
Cash-Flowing Duplex - Tenants In Place, Income From Day One. Two occupied units. Zero vacancy headaches. The downstairs one-bedroom earns $1,200/month. The upstairs two-bedroom generates an effective $800/month - the tenant handles property maintenance in exchange for a $400 credit, eliminating property management costs. The upside is real: Utah permits up to three unrelated occupants per unit, giving this property a six-renter income ceiling well above what's currently being collected. Mechanicals are dialed in - gas boiler recently inspected and passed, gas dryer on-site. Turnkey. Cash-flowing. Ready for you now.
Property Type
Residential
Property Style
Duplex
Architectural Style
Stories: 1
County
Cache
Zoning
Multi-Family
Construction
Aluminum
Lot Size
0.12 sq ft
Condition
Blt./Standing
MLS #
2159954
Property Type
Residential
Property Style
Duplex
Architectural Style
Stories: 1
County
Cache
Zoning
Multi-Family
Construction
Aluminum
Lot Size
0.12 sq ft
Condition
Blt./Standing
MLS #
2159954
List Price
$350,000
Annual Taxes
$1,245
Home Warranty
No
List Price
$350,000
Annual Taxes
$1,245
Home Warranty
No
Heating
Gas: Central
Roof
Asphalt
Flooring
Carpet,Laminate,Linoleum
Materials
Aluminum
Laundry
Gas Dryer Hookup
Patio & Porch
Porch: Open
Water Source
Culinary
Sewer
Sewer: Connected
View
Mountain(s),Valley
Heating
Gas: Central
Roof
Asphalt
Flooring
Carpet,Laminate,Linoleum
Materials
Aluminum
Laundry
Gas Dryer Hookup
Patio & Porch
Porch: Open
Water Source
Culinary
Sewer
Sewer: Connected
View
Mountain(s),Valley
Garage Spaces
2
Covered Spaces
2
Total Parking
7
Garage Spaces
2
Covered Spaces
2
Total Parking
7
Listing facts changed since this intelligence snapshot was scored.
Review the current MLS facts before relying on AVM-backed pricing or investment metrics.
Why this is a deal
Classification
Great Deal (vs Similar)
Deal Score
100/100
vs Similar Homes
41% below
vs Market Median
3% below
Area Growth (YoY)
12.1%
Deal Score Breakdown
100/100 · 2 qualifying signals
Priced 41% below the median of similar listings
12.1% year-over-year ZHVI growth in this area
Priced 3% below the per-subtype city median
STR net cashflow -$1,636/mo (-69.3% return). Uses the better of LT or STR against total monthly ownership cost (P&I, tax, insurance, HOA, maintenance).
No price reduction from original list
Ensemble scoring: the best single signal sets the floor, secondary qualifying signals (≥60) each add 5 points up to +20. A home that strongly wins on one dimension is already a great deal — it doesn't need to tick every box.
Why this classification
Est. Annual Revenue
$12,391/yr
$216/night · 49% occupancy · $80/bedroom · $0.13/sqft
Net Monthly Cash Flow
−$1,638 /mo (−$19,650/yr)
Monthly STR income
Monthly ownership cost
Coverage
44%
Net /mo
−$1,636
DSCR
0.41
Best Download
8 Gbps
Best Upload
8 Gbps
Fiber Available
Yes
Providers
13
Available Providers
$425,000
-18% vs median
55 days
146
$214,900 – $4,190,000
$1,245
Moderate
9.9
per 1,000
18.3
per 1,000
13.7
per 1,000
41.9
per 1,000
National rates use FBI UCR Index Crimes. Local rates use NIBRS which may include additional offense categories.
Select agents you’d like to hear from. They’ll be notified of your interest — your contact details stay private until you choose to respond.
Your inquiry goes to the listing agent.
Fast Response
Typically within 2 hours during business hours
Built with AI to help you find your perfect home
Powered by AI • Secured by Supabase • Trusted by Agents