667 100, Logan, UT 84321
5BD/—BA Residential in Logan, UT 84321. 2,565 sqft. Built 1958. Listed at $549,900. MLS #2155146.
5BD/—BA Residential in Logan, UT 84321. 2,565 sqft. Built 1958. Listed at $549,900. MLS #2155146.
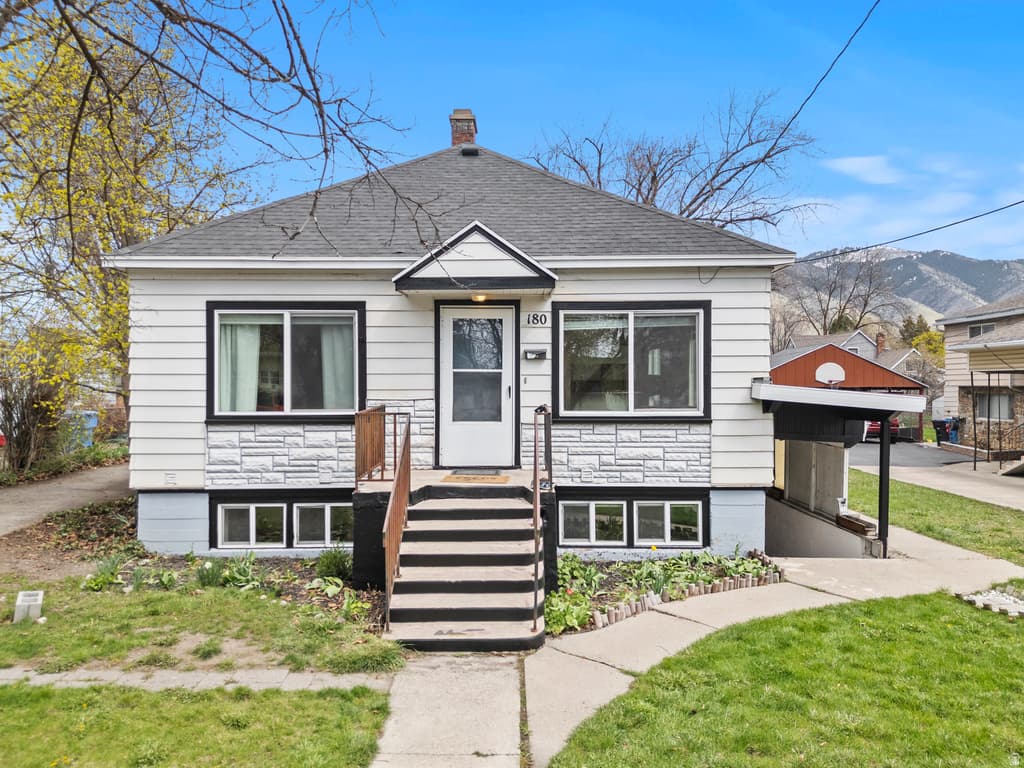
This centrally located DUPLEX features a spacious 4-bdrm, 2-bath main unit, along with a separate 1-bdrm, 1-bath basement apartment. Perfect for rental income or multi-generational living. Large 2-car garage. Situated on a generous .37-acre lot, the fenced backyard offers a sprinkler system, basketball court, and plenty of space for outdoor entertaining and recreation. Centrally located.
Property Type
Residential
Property Style
Duplex
Architectural Style
Up And Down
County
Cache
Zoning
Multi-Family
Construction
Brick
Lot Size
0.37 sq ft
Condition
Blt./Standing
MLS #
2155146
Property Type
Residential
Property Style
Duplex
Architectural Style
Up And Down
County
Cache
Zoning
Multi-Family
Construction
Brick
Lot Size
0.37 sq ft
Condition
Blt./Standing
MLS #
2155146
List Price
$549,900
Original Price
$569,900
Annual Taxes
$2,174
Home Warranty
No
List Price
$549,900
Original Price
$569,900
Annual Taxes
$2,174
Home Warranty
No
Heating
Forced Air,Gas: Central
Roof
Aluminum
Flooring
Carpet,Tile
Materials
Brick
Laundry
Electric Dryer Hookup,Gas Dryer Hookup
Patio & Porch
Covered
Water Source
Culinary,Irrigation,Rights: Owned
Sewer
Sewer: Connected,Sewer: Public
Heating
Forced Air,Gas: Central
Roof
Aluminum
Flooring
Carpet,Tile
Materials
Brick
Laundry
Electric Dryer Hookup,Gas Dryer Hookup
Patio & Porch
Covered
Water Source
Culinary,Irrigation,Rights: Owned
Sewer
Sewer: Connected,Sewer: Public
Garage Spaces
2
Covered Spaces
3
Total Parking
7
Garage Spaces
2
Covered Spaces
3
Total Parking
7
$425,000
+29% vs median
55 days
146
$214,900 – $4,190,000
$2,174
Moderate
9.9
per 1,000
18.3
per 1,000
13.7
per 1,000
41.9
per 1,000
National rates use FBI UCR Index Crimes. Local rates use NIBRS which may include additional offense categories.
Your inquiry goes to the listing agent.
Fast Response
Typically within 2 hours during business hours
Built with AI to help you find your perfect home
Powered by AI • Secured by Supabase • Trusted by Agents