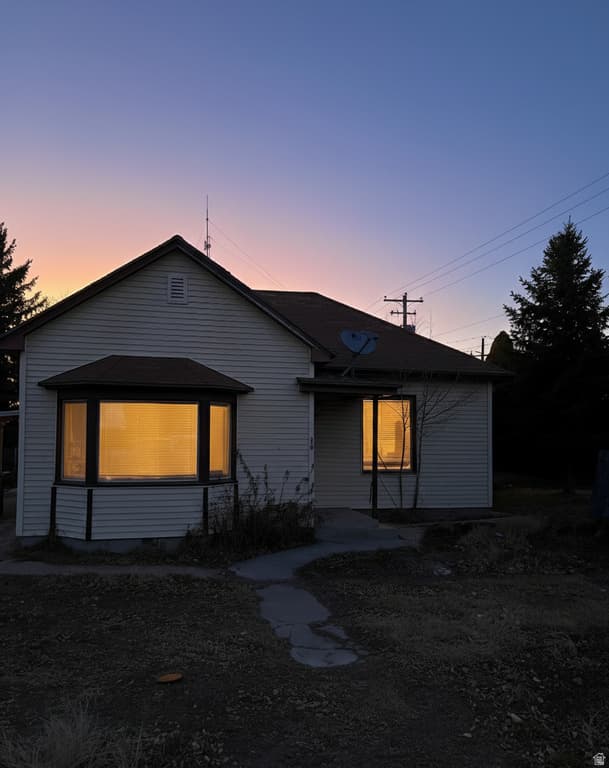
210 CENTER, Gunnison, UT 84634
4BD/—BA Residential in Gunnison, UT 84634. 2,244 sqft. Built 1942. Listed at $265,000. MLS #2166121.
4BD/—BA Residential in Gunnison, UT 84634. 2,244 sqft. Built 1942. Listed at $265,000. MLS #2166121.
Over half acre lot. 2 bedrooms and 2 baths on main level plus more in finished basement. This house is a HUD owned home and your agent can show and then if you want to put an offer, it is an electronic bid on HUD's website. This house can go FHA with some repairs escrowed by buyer. $100 down payment program available with an FHA loan, call with questions or for a showing! Equal housing opportunity
Property Type
Residential
Property Style
Single Family Residence
Architectural Style
Rambler/Ranch
Stories
2
County
Sanpete
Zoning
Single-Family
Construction
Asphalt
Lot Size
0.52 sq ft
Above Grade Area
1,122 sq ft
Condition
Blt./Standing
MLS #
2166121
Property Type
Residential
Property Style
Single Family Residence
Architectural Style
Rambler/Ranch
Stories
2
County
Sanpete
Zoning
Single-Family
Construction
Asphalt
Lot Size
0.52 sq ft
Above Grade Area
1,122 sq ft
Condition
Blt./Standing
MLS #
2166121
List Price
$265,000
Annual Taxes
$1,473
Home Warranty
No
List Price
$265,000
Annual Taxes
$1,473
Home Warranty
No
Heating
Forced Air,Gas: Central
Roof
Asphalt,Pitched
Flooring
Hardwood
Basement
Entrance,Full
Materials
Asphalt
Laundry
Gas Dryer Hookup
Patio & Porch
Porch: Open
Water Source
Culinary
Sewer
Sewer: Available
Heating
Forced Air,Gas: Central
Roof
Asphalt,Pitched
Flooring
Hardwood
Basement
Entrance,Full
Materials
Asphalt
Laundry
Gas Dryer Hookup
Patio & Porch
Porch: Open
Water Source
Culinary
Sewer
Sewer: Available
Covered Spaces
0
Total Parking
2
Covered Spaces
0
Total Parking
2
Why this is a deal
Classification
Exceptional DealDeal Score
100/100
vs Similar Homes
46% below
vs Market Median
27% below
Area Growth (YoY)
15.3%
Deal Score Breakdown
100/100 · 3 qualifying signals
Priced 46% below the median of similar listings
15.3% year-over-year ZHVI growth in this area
Priced 27% below the per-subtype city median
STR net cashflow -$1,083/mo (-60.0% return). Uses the better of LT or STR against total monthly ownership cost (P&I, tax, insurance, HOA, maintenance).
No price reduction from original list
Ensemble scoring: the best single signal sets the floor, secondary qualifying signals (≥60) each add 5 points up to +20. A home that strongly wins on one dimension is already a great deal — it doesn't need to tick every box.
Why this classification
Est. Annual Revenue
$12,401/yr
$171/night · 39% occupancy · $84/bedroom · $0.06/sqft
Net Monthly Cash Flow
−$1,084 /mo (−$13,007/yr)
Monthly STR income
Monthly ownership cost
Coverage
57%
Net /mo
−$1,083
DSCR
0.54
School District
South Sanpete
$350,000
-24% vs median
86 days
9
$265,000 – $14,775,000
$1,473
Select agents you’d like to hear from. They’ll be notified of your interest — your contact details stay private until you choose to respond.
Your inquiry goes to the listing agent.
Fast Response
Typically within 2 hours during business hours
Built with AI to help you find your perfect home
Powered by AI • Secured by Supabase • Trusted by Agents