2468 SAN JOSE, Moab, UT 84532
3BD/—BA Residential in Moab, UT 84532. 1,296 sqft. Built 1994. Listed at $785,000. MLS #2116921.
3BD/—BA Residential in Moab, UT 84532. 1,296 sqft. Built 1994. Listed at $785,000. MLS #2116921.
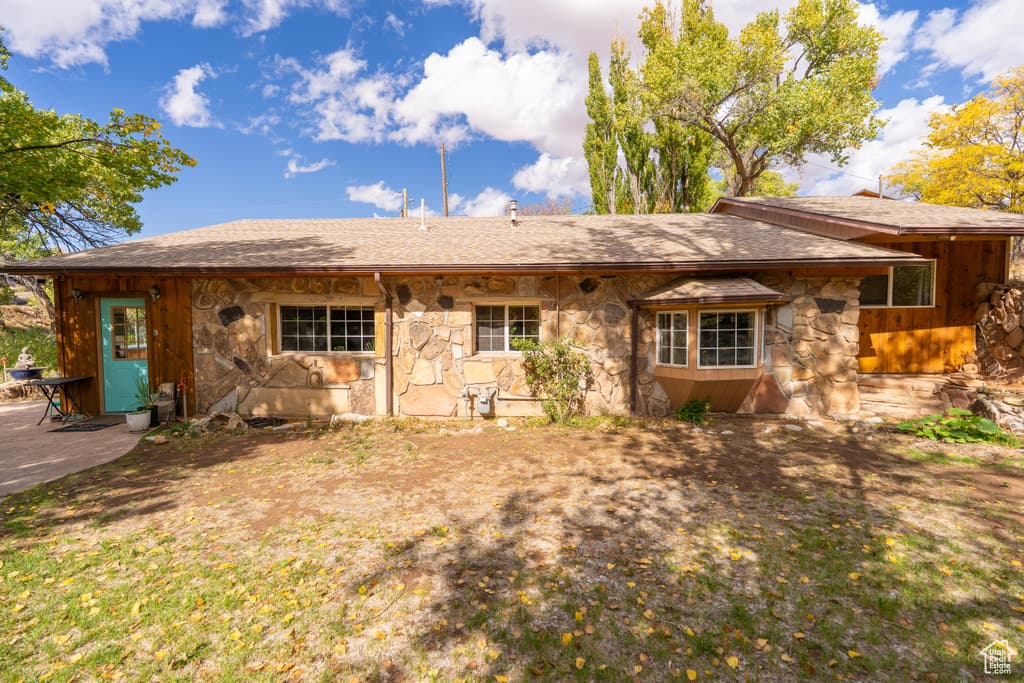
Two Homes, One Lot Endless Possibilities! This unique property offers the opportunity to enjoy two residences on a single lot. Live in one and rent the other, enjoy steady income from renting both, or create the perfect multi-generational setup. With flexible use options, the second home can serve as an income-producing rental, home office, or studio space. This large lot is a smart investment for long-term value. An ideal blend of lifestyle and investment-enjoy comfort, flexibility, and financial upside all on one property. Easy access to downtown Moab with ample parking.
Property Type
Residential
Property Style
Single Family Residence
Architectural Style
Rambler/Ranch
Stories
1
Subdivision
J & M SUBDIVISION
County
Grand
Zoning
Single-Family
Construction
Cinder Block
Lot Size
0.48 sq ft
Above Grade Area
1,296 sq ft
Condition
Blt./Standing
MLS #
2116921
Property Type
Residential
Property Style
Single Family Residence
Architectural Style
Rambler/Ranch
Stories
1
Subdivision
J & M SUBDIVISION
County
Grand
Zoning
Single-Family
Construction
Cinder Block
Lot Size
0.48 sq ft
Above Grade Area
1,296 sq ft
Condition
Blt./Standing
MLS #
2116921
List Price
$785,000
Annual Taxes
$1,383
Home Warranty
No
List Price
$785,000
Annual Taxes
$1,383
Home Warranty
No
Heating
Forced Air,Gas: Central
Cooling
Central Air
Roof
Asphalt
Flooring
Carpet,Laminate
Basement
None
Materials
Cinder Block
Appliances
Refrigerator
Laundry
Electric Dryer Hookup
Patio & Porch
Patio: Open
Water Source
Culinary
Sewer
Sewer: Connected,Sewer: Public
View
View: Red Rock
Heating
Forced Air,Gas: Central
Cooling
Central Air
Roof
Asphalt
Flooring
Carpet,Laminate
Basement
None
Materials
Cinder Block
Appliances
Refrigerator
Laundry
Electric Dryer Hookup
Patio & Porch
Patio: Open
Water Source
Culinary
Sewer
Sewer: Connected,Sewer: Public
View
View: Red Rock
Covered Spaces
0
Total Parking
8
Covered Spaces
0
Total Parking
8
$645,000
+22% vs median
174 days
151
$100,000 – $4,995,000
$1,383
High Crime
27.2
per 1,000
27.1
per 1,000
18.2
per 1,000
72.5
per 1,000
National rates use FBI UCR Index Crimes. Local rates use NIBRS which may include additional offense categories.
Your inquiry goes to the listing agent.
Fast Response
Typically within 2 hours during business hours
Built with AI to help you find your perfect home
Powered by AI • Secured by Supabase • Trusted by Agents