499 200, Moab, UT 84532
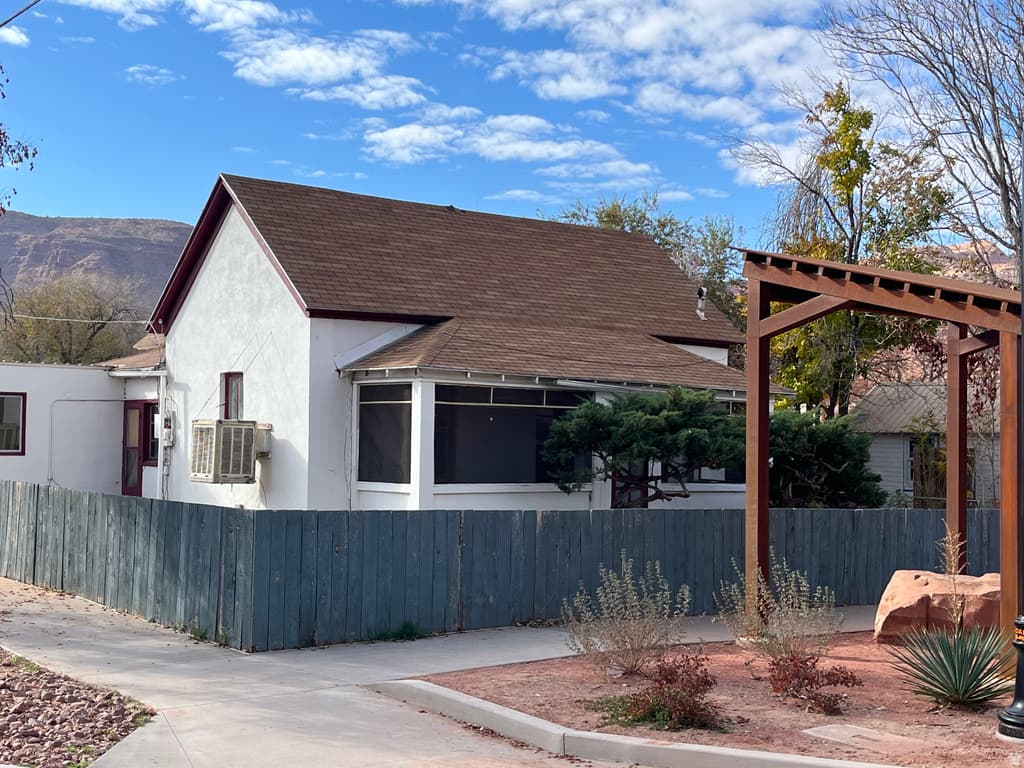
3BD/—BA Residential in Moab, UT 84532. 1,023 sqft. Built 1954. Listed at $499,900. MLS #2103589.
3BD/—BA Residential in Moab, UT 84532. 1,023 sqft. Built 1954. Listed at $499,900. MLS #2103589.
Cozy home with a fenced yard and a 2-car garage. New bathroom, new kitchen, updated sewer, main, and lateral lines, metal roof, and hardwood floors. Perfect as a home-base for an adventure enthusiast. Walking distance to downtown Moab and schools. 15 minute drive to Arches National Park, 35 minutes to Canyonlands National Park and in close proximity to many ATV trails, climbing areas, rafting, and mountain biking.
Property Type
Residential
Property Style
Single Family Residence
Architectural Style
Bungalow/Cottage
Stories
1
County
Grand
Construction
Aluminum
Lot Size
0.16 sq ft
Above Grade Area
1,023 sq ft
Condition
Blt./Standing
MLS #
2103589
Property Type
Residential
Property Style
Single Family Residence
Architectural Style
Bungalow/Cottage
Stories
1
County
Grand
Construction
Aluminum
Lot Size
0.16 sq ft
Above Grade Area
1,023 sq ft
Condition
Blt./Standing
MLS #
2103589
List Price
$499,900
Annual Taxes
$2,013
Home Warranty
No
List Price
$499,900
Annual Taxes
$2,013
Home Warranty
No
Heating
Forced Air
Cooling
Evaporative Cooling
Roof
Metal
Flooring
Hardwood,Tile
Basement
None
Materials
Aluminum
Appliances
Dryer,Refrigerator,Washer
Laundry
Electric Dryer Hookup
Water Source
Culinary
Sewer
Sewer: Public
View
Mountain(s)
Heating
Forced Air
Cooling
Evaporative Cooling
Roof
Metal
Flooring
Hardwood,Tile
Basement
None
Materials
Aluminum
Appliances
Dryer,Refrigerator,Washer
Laundry
Electric Dryer Hookup
Water Source
Culinary
Sewer
Sewer: Public
View
Mountain(s)
Garage Spaces
2
Covered Spaces
2
Total Parking
2
Garage Spaces
2
Covered Spaces
2
Total Parking
2
$645,000
-22% vs median
174 days
151
$100,000 – $4,995,000
$2,013
High Crime
27.2
per 1,000
27.1
per 1,000
18.2
per 1,000
72.5
per 1,000
National rates use FBI UCR Index Crimes. Local rates use NIBRS which may include additional offense categories.
Your inquiry goes to the listing agent.
Fast Response
Typically within 2 hours during business hours
Built with AI to help you find your perfect home
Powered by AI • Secured by Supabase • Trusted by Agents