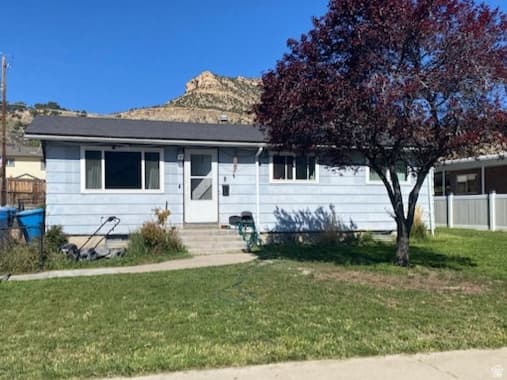
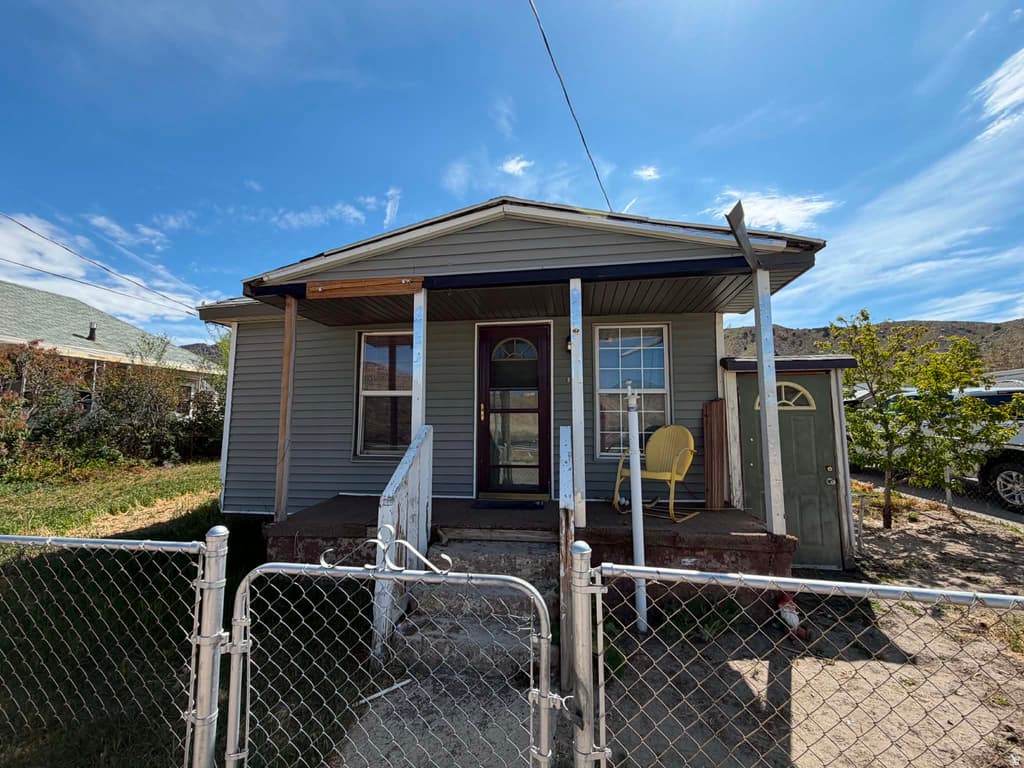
819 CASTLE GATE, Helper, UT 84526
3BD/—BA Residential in Helper, UT 84526. 2,398 sqft. Built 1980. Listed at $289,900. MLS #2154489.
3BD/—BA Residential in Helper, UT 84526. 2,398 sqft. Built 1980. Listed at $289,900. MLS #2154489.
GREAT PRICE for this 2,398 sq. ft. rambler style home nestled in a quiet cul-de-sac in the Castle Gate Subdivision in Helper! Beautiful views from this 3 bdrm 1 1/2 bath home, 1 car detached garage, newer roof, tons of storage, 2 sheds, fruit trees include apple & peach. One shed has been removed to make the backyard bigger. All appliances are included!
Property Type
Residential
Property Style
Single Family Residence
Architectural Style
Rambler/Ranch
Stories
2
Subdivision
SPRING CANYON ESTATES
County
Carbon
Zoning
Single-Family
Lot Size
0.16 sq ft
Above Grade Area
1,140 sq ft
Condition
Blt./Standing
MLS #
2154489
Property Type
Residential
Property Style
Single Family Residence
Architectural Style
Rambler/Ranch
Stories
2
Subdivision
SPRING CANYON ESTATES
County
Carbon
Zoning
Single-Family
Lot Size
0.16 sq ft
Above Grade Area
1,140 sq ft
Condition
Blt./Standing
MLS #
2154489
List Price
$289,900
Annual Taxes
$1,796
Home Warranty
No
List Price
$289,900
Annual Taxes
$1,796
Home Warranty
No
Heating
Forced Air
Cooling
Central Air
Roof
Asphalt
Flooring
Carpet,Linoleum
Basement
Full
Appliances
Dryer,Range Hood,Refrigerator,Washer,Water Softener Owned
Water Source
Culinary
Sewer
Sewer: Connected
View
Mountain(s)
Heating
Forced Air
Cooling
Central Air
Roof
Asphalt
Flooring
Carpet,Linoleum
Basement
Full
Appliances
Dryer,Range Hood,Refrigerator,Washer,Water Softener Owned
Water Source
Culinary
Sewer
Sewer: Connected
View
Mountain(s)
Garage Spaces
1
Covered Spaces
1
Total Parking
1
Garage Spaces
1
Covered Spaces
1
Total Parking
1
Why this is a deal
Classification
Growth Market DealDeal Score
100/100
vs Similar Homes
9% above
vs Market Median
14% below
Area Growth (YoY)
20.6%
Deal Score Breakdown
100/100 · 2 qualifying signals
20.6% year-over-year ZHVI growth in this area
Priced 14% below the per-subtype city median
STR net cashflow -$337/mo (-16.9% return). Uses the better of LT or STR against total monthly ownership cost (P&I, tax, insurance, HOA, maintenance).
Priced 9% above the median of similar listings
No price reduction from original list
Ensemble scoring: the best single signal sets the floor, secondary qualifying signals (≥60) each add 5 points up to +20. A home that strongly wins on one dimension is already a great deal — it doesn't need to tick every box.
Why this classification
Est. Annual Revenue
$28,364/yr
$94/night · 73% occupancy · $50/bedroom · $0.09/sqft
Net Monthly Cash Flow
−$336 /mo (−$4,029/yr)
Monthly STR income
Monthly ownership cost
Coverage
119%
Net /mo
−$337
DSCR
1.14
Best Download
1 Gbps
Best Upload
1 Gbps
Fiber Available
Yes
Providers
8
Available Providers
$325,575
-11% vs median
116 days
14
$155,000 – $1,100,000
$1,796
High Crime
16.0
per 1,000
23.0
per 1,000
32.5
per 1,000
71.5
per 1,000
National rates use FBI UCR Index Crimes. Local rates use NIBRS which may include additional offense categories.
Select agents you’d like to hear from. They’ll be notified of your interest — your contact details stay private until you choose to respond.
Your inquiry goes to the listing agent.
Fast Response
Typically within 2 hours during business hours
Built with AI to help you find your perfect home
Powered by AI • Secured by Supabase • Trusted by Agents