338 300, Helper, UT 84526
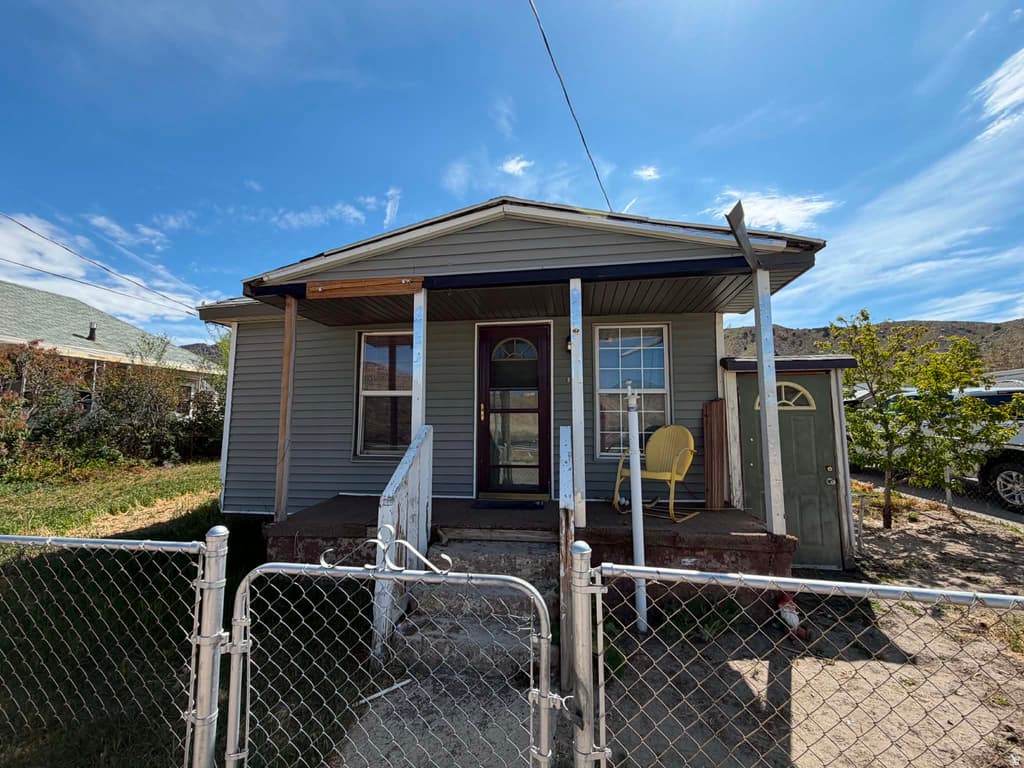
3BD/—BA Residential in Helper, UT 84526. 1,596 sqft. Built 1912. Listed at $259,000. MLS #2152945.
3BD/—BA Residential in Helper, UT 84526. 1,596 sqft. Built 1912. Listed at $259,000. MLS #2152945.
River front one level living! Over 1500 sq ft on the main level with a rear den that features a wet bar and sliding door to covered deck. Relax on your covered deck and listen to the river flow by! Walking distance to Historic Downtown Helper Main Street. Great investment opportunity! Square footage figures are provided as a courtesy estimate only and were obtained from county records. Buyer is advised to obtain an independent measurement and verify all listing information
Property Type
Residential
Property Style
Single Family Residence
Architectural Style
Bungalow/Cottage
Stories
1
Subdivision
PRATTS SURVEY OF WEL
County
Carbon
Zoning
Single-Family
Construction
Aluminum
Lot Size
0.08 sq ft
Above Grade Area
1,596 sq ft
Condition
Blt./Standing
MLS #
2152945
Property Type
Residential
Property Style
Single Family Residence
Architectural Style
Bungalow/Cottage
Stories
1
Subdivision
PRATTS SURVEY OF WEL
County
Carbon
Zoning
Single-Family
Construction
Aluminum
Lot Size
0.08 sq ft
Above Grade Area
1,596 sq ft
Condition
Blt./Standing
MLS #
2152945
List Price
$259,000
Annual Taxes
$698
Home Warranty
No
List Price
$259,000
Annual Taxes
$698
Home Warranty
No
Heating
Forced Air,Gas: Central
Cooling
Evaporative Cooling
Roof
Asphalt
Flooring
Carpet,Laminate
Basement
Partial
Materials
Aluminum
Appliances
Refrigerator
Water Source
Culinary
Sewer
Sewer: Connected,Sewer: Public
Heating
Forced Air,Gas: Central
Cooling
Evaporative Cooling
Roof
Asphalt
Flooring
Carpet,Laminate
Basement
Partial
Materials
Aluminum
Appliances
Refrigerator
Water Source
Culinary
Sewer
Sewer: Connected,Sewer: Public
Covered Spaces
2
Total Parking
2
Covered Spaces
2
Total Parking
2
Why this is a deal
Classification
Growth Market DealDeal Score
100/100
vs Similar Homes
6% below
vs Market Median
6% below
Area Growth (YoY)
15.4%
Deal Score Breakdown
100/100 · 3 qualifying signals
15.4% year-over-year ZHVI growth in this area
Priced 6% below the median of similar listings
Priced 6% below the per-subtype city median
STR net cashflow -$937/mo (-55.0% return). Uses the better of LT or STR against total monthly ownership cost (P&I, tax, insurance, HOA, maintenance).
No price reduction from original list
Ensemble scoring: the best single signal sets the floor, secondary qualifying signals (≥60) each add 5 points up to +20. A home that strongly wins on one dimension is already a great deal — it doesn't need to tick every box.
Why this classification
Est. Annual Revenue
$13,139/yr
$97/night · 39% occupancy · $63/bedroom · $0.07/sqft
Net Monthly Cash Flow
−$938 /mo (−$11,252/yr)
Monthly STR income
Monthly ownership cost
Coverage
64%
Net /mo
−$937
DSCR
0.59
Best Download
1 Gbps
Best Upload
1 Gbps
Fiber Available
Yes
Providers
8
Available Providers
$325,575
-20% vs median
116 days
14
$155,000 – $1,100,000
$698
High Crime
16.0
per 1,000
23.0
per 1,000
32.5
per 1,000
71.5
per 1,000
National rates use FBI UCR Index Crimes. Local rates use NIBRS which may include additional offense categories.
Select agents you’d like to hear from. They’ll be notified of your interest — your contact details stay private until you choose to respond.
Your inquiry goes to the listing agent.
Fast Response
Typically within 2 hours during business hours
Built with AI to help you find your perfect home
Powered by AI • Secured by Supabase • Trusted by Agents