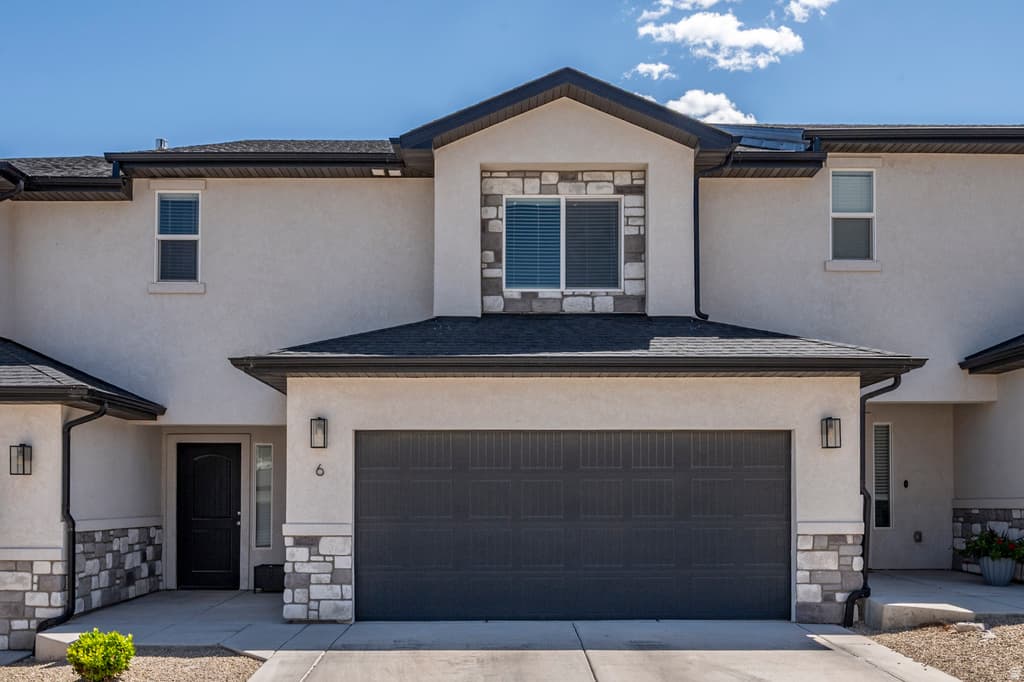
668 FIDDLERS COVE, Cedar City, UT 84720
3BD/—BA Residential in Cedar City, UT 84720. 1,734 sqft. Built 2020. Listed at $337,500. MLS #2151522.
3BD/—BA Residential in Cedar City, UT 84720. 1,734 sqft. Built 2020. Listed at $337,500. MLS #2151522.
Beautiful townhome with fabulous amenities! Fenced rear patio, open kitchen/great room, fireplace. Common area includes dog park, playground, pickleball court and picnic area.
Property Type
Residential
Property Style
Townhouse
Architectural Style
Stories: 2
Stories
2
Subdivision
SHADOW COVE
County
Iron
Construction
Asphalt,Frame
Lot Size
0.03 sq ft
Above Grade Area
1,734 sq ft
Condition
Blt./Standing
MLS #
2151522
Property Type
Residential
Property Style
Townhouse
Architectural Style
Stories: 2
Stories
2
Subdivision
SHADOW COVE
County
Iron
Construction
Asphalt,Frame
Lot Size
0.03 sq ft
Above Grade Area
1,734 sq ft
Condition
Blt./Standing
MLS #
2151522
List Price
$337,500
HOA Fees
$140 / Monthly
Annual Taxes
$1,525
Home Warranty
No
List Price
$337,500
HOA Fees
$140 / Monthly
Annual Taxes
$1,525
Home Warranty
No
Heating
Electric
Cooling
Central Air
Roof
Asphalt
Flooring
Carpet
Basement
None
Materials
Asphalt,Frame
Appliances
Ceiling Fan,Microwave,Range Hood
Patio & Porch
Patio: Open
Water Source
Culinary
Sewer
Sewer: Connected
View
Mountain(s)
Heating
Electric
Cooling
Central Air
Roof
Asphalt
Flooring
Carpet
Basement
None
Materials
Asphalt,Frame
Appliances
Ceiling Fan,Microwave,Range Hood
Patio & Porch
Patio: Open
Water Source
Culinary
Sewer
Sewer: Connected
View
Mountain(s)
Garage Spaces
2
Covered Spaces
2
Total Parking
2
Garage Spaces
2
Covered Spaces
2
Total Parking
2
Why this is a deal
Classification
Standard
Deal Score
100/100
vs Similar Homes
10% above
vs Market Median
0% above
Area Growth (YoY)
12.1%
Deal Score Breakdown
100/100 · 1 qualifying signal
12.1% year-over-year ZHVI growth in this area
Priced 0% above the per-subtype city median
Priced 10% above the median of similar listings
LT net cashflow -$635/mo (-26.3% return on ownership cost) · STR net cashflow -$1,499/mo (-62.2% return). Uses the better of LT or STR against total monthly ownership cost (P&I, tax, insurance, HOA, maintenance).
No price reduction from original list
Ensemble scoring: the best single signal sets the floor, secondary qualifying signals (≥60) each add 5 points up to +20. A home that strongly wins on one dimension is already a great deal — it doesn't need to tick every box.
Why this classification
Monthly Rent
$2,018/mo
Range: $1,446 – $2,589
Net Monthly Cash Flow
−$635 /mo (−$7,623/yr)
Monthly rental income
Monthly ownership cost
Coverage
84%
Net /mo
−$635
DSCR
1.05
Est. Annual Revenue
$15,636/yr
$140/night · 42% occupancy · $62/bedroom · $0.09/sqft
Net Monthly Cash Flow
−$1,498 /mo (−$17,979/yr)
Monthly STR income
Monthly ownership cost
Coverage
54%
Net /mo
−$1,499
DSCR
0.54
Best Download
1 Gbps
Best Upload
1 Gbps
Fiber Available
Yes
Providers
11
Available Providers
$415,000
-19% vs median
65 days
175
$223,000 – $5,750,000
$1,525
$140/monthly
Low Crime
9.4
per 1,000
18.3
per 1,000
7.4
per 1,000
35.1
per 1,000
National rates use FBI UCR Index Crimes. Local rates use NIBRS which may include additional offense categories.
Select agents you’d like to hear from. They’ll be notified of your interest — your contact details stay private until you choose to respond.

Devin Tanner - Utah Realtor
Your inquiry goes to the listing agent.
Fast Response
Typically within 2 hours during business hours
Built with AI to help you find your perfect home
Powered by AI • Secured by Supabase • Trusted by Agents