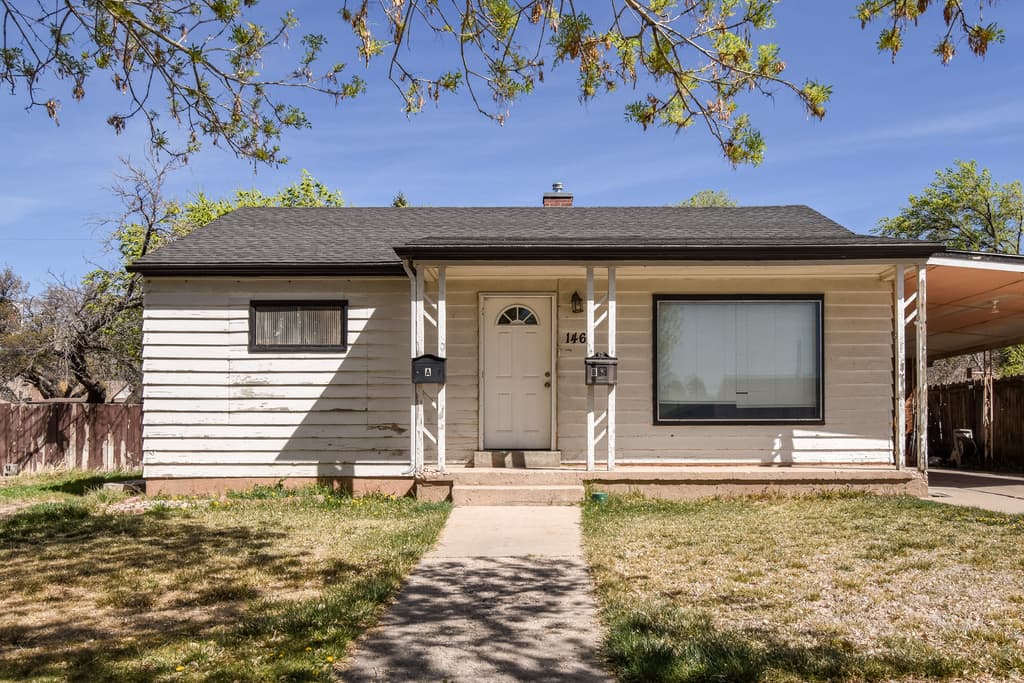
574 HARDING, Cedar City, UT 84720
6BD/—BA Residential in Cedar City, UT 84720. 2,344 sqft. Built 1965. Listed at $569,000. MLS #2140458.
6BD/—BA Residential in Cedar City, UT 84720. 2,344 sqft. Built 1965. Listed at $569,000. MLS #2140458.
PRICE REDUCED $20K!!! Location , Location, Location! Great investment opportunity across the street from the SUU campus. This property has 2 kitchens, 6 bedrooms, and lots of storage. It is currently rented to 8 students. Please do not disturb tenants.
Property Type
Residential
Property Style
Single Family Residence
Architectural Style
Stories: 2
Stories
3
County
Iron
Zoning
Single-Family
Construction
Brick,Cinder Block,Clapboard/Masonite
Lot Size
0.15 sq ft
Above Grade Area
2,204 sq ft
Condition
Blt./Standing
MLS #
2140458
Property Type
Residential
Property Style
Single Family Residence
Architectural Style
Stories: 2
Stories
3
County
Iron
Zoning
Single-Family
Construction
Brick,Cinder Block,Clapboard/Masonite
Lot Size
0.15 sq ft
Above Grade Area
2,204 sq ft
Condition
Blt./Standing
MLS #
2140458
List Price
$569,000
Original Price
$619,000
Annual Taxes
$1,513
Home Warranty
No
List Price
$569,000
Original Price
$619,000
Annual Taxes
$1,513
Home Warranty
No
Heating
Gas: Central
Cooling
Central Air
Roof
Metal
Flooring
Carpet,Laminate,Tile
Basement
Partial
Materials
Brick,Cinder Block,Clapboard/Masonite
Appliances
Microwave,Refrigerator
Patio & Porch
Patio: Open
Water Source
Culinary
Sewer
Sewer: Connected
Heating
Gas: Central
Cooling
Central Air
Roof
Metal
Flooring
Carpet,Laminate,Tile
Basement
Partial
Materials
Brick,Cinder Block,Clapboard/Masonite
Appliances
Microwave,Refrigerator
Patio & Porch
Patio: Open
Water Source
Culinary
Sewer
Sewer: Connected
Covered Spaces
0
Total Parking
1
Covered Spaces
0
Total Parking
1
Why this is a deal
Classification
Standard
Deal Score
100/100
vs Similar Homes
14% above
vs Market Median
98% above
Price Reduced
8.1%
Area Growth (YoY)
12.8%
Deal Score Breakdown
100/100 · 2 qualifying signals
12.8% year-over-year ZHVI growth in this area
8% price reduction from original list — seller may be motivated
LT net cashflow -$725/mo (-19.1% return on ownership cost) · STR net cashflow -$2,007/mo (-53.0% return). Uses the better of LT or STR against total monthly ownership cost (P&I, tax, insurance, HOA, maintenance).
Priced 14% above the median of similar listings
Priced 98% above the per-subtype city median
Ensemble scoring: the best single signal sets the floor, secondary qualifying signals (≥60) each add 5 points up to +20. A home that strongly wins on one dimension is already a great deal — it doesn't need to tick every box.
Why this classification
Monthly Rent
$3,479/mo
Range: $2,489 – $4,468
Net Monthly Cash Flow
−$724 /mo (−$8,687/yr)
Monthly rental income
Monthly ownership cost
Coverage
92%
Net /mo
−$725
DSCR
1.06
Est. Annual Revenue
$30,489/yr
$117/night · 62% occupancy · $59/bedroom · $0.12/sqft
Net Monthly Cash Flow
−$2,007 /mo (−$24,086/yr)
Monthly STR income
Monthly ownership cost
Coverage
67%
Net /mo
−$2,007
DSCR
0.61
Best Download
1 Gbps
Best Upload
1 Gbps
Fiber Available
Yes
Providers
10
Available Providers
$415,000
+37% vs median
76 days
161
$223,000 – $5,750,000
$1,513
Low Crime
9.4
per 1,000
18.3
per 1,000
7.4
per 1,000
35.1
per 1,000
National rates use FBI UCR Index Crimes. Local rates use NIBRS which may include additional offense categories.
Select agents you’d like to hear from. They’ll be notified of your interest — your contact details stay private until you choose to respond.

Devin Tanner - Utah Realtor

Celeste Green - Utah Real Estate Agent
Your inquiry goes to the listing agent.
Fast Response
Typically within 2 hours during business hours
Built with AI to help you find your perfect home
Powered by AI • Secured by Supabase • Trusted by Agents